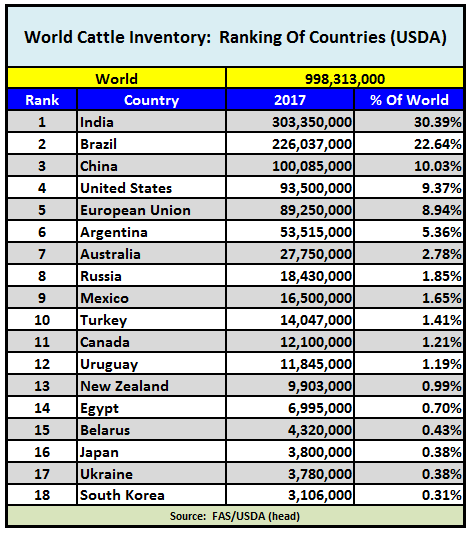
World
Wheat , Maize (Corn), Rice, and Cotton
World
Wheat , Maize (Corn), Rice, and Cotton

17% of the worlds maize production takes place on marginal landscapes
Cinteotl, Aztec maize deity
| Country | Maize area, ha | Maize production, Mt | Yield, Mt/ha |
| World 2012 | 177,379,507 | 872,066,770 | 4.9 |
| World 2013 | 185,121,343 | ||
| World 2014 | 183,319,737 | ||
| USA | 35,359,790 | 273,832,130 | 7.8 |
| Brazil | 14,198,496 | 71,072,810 | 5.1 |
| China | 34,966,000 | 208,234,649 | 6.1 |
| India | 8,400,000 | 21,060,000 | 3.04 |
| Mexico | 6,923,900 | 22,069,294 | 3.18 |
| Argentina | 3,696,300 | 21,196,637 | 5.83 |
| AFRICA | 1.98 | ||
| Country | Wheat area, ha | Wheat production, Mt | Yield, Mt/ha |
| World 2013 | 215,489,485 | 670,875,110 | 3.11 |
| World 2014 | 220,417,745 | ||
| China | 24,139,000 | 120,580,000 | 5.0 |
| India | 29,900,900 | 94,880,000 | 3.2 |
| Russian Fed. | 21,277,900 | 37,719,640 | 1.8 |
| USA | 19,826,170 | 61,755,240 | 3.2 |
| Australia | 13,920,140 | 29,905,009 | 2.2 |
| France | 5,303,300 | 40,300,800 | 8.0 |
| OK 2008 Metric | 2,545,000 ha | 4,532,667 Mt | 2.75 |
| Oklahoma 2013 | 5.5 million acres | 115,500,000 bu | 33 bu/ac |
| Oklahoma 2012 | 5.4 million acres | 154,800,000 bu | 36 bu/ac |
| Oklahoma 2009 | 5.4 million acres | 77,000,000 bu | 22 bu/ac |
| Oklahoma 2008 | 6.3 million acres | 166,500,000 bu | 41 bu/ac |
| Oklahoma 2007 | 6.0 million acres | 82,402,000 bu | 30 bu/ac |
| Country | Rice area, ha | Rice production, Mt | Yield, Mt/ha |
| WORLD | 163,199,090 | 719,738,273 | 4.41 |
| India | 42,500,000 | 152,600,000 | 3.57 |
| China | 30,297,000 | 204,285,000 | 6.73 |
| Indonesia | 13,443,443 | 69,045,141 | 5.30 |
| Bangladesh | 11,553,452 | 33,889,632 | 2.93 |
| Thailand | 12,600,000 | 37,800,000 | 2.93 |
| Viet Nam | 7,753,3163 | 43,661,570 | 5.58 |
Cotton 2012
US 9.4 million acres
South Carolina 300,000 acres
Ok 150,000 acres, Keep in mind this was mid
Drought.
Cotton 2007
US 10.5 million acres
South Carolina 160,000 acres
Oklahoma 165,000 acres
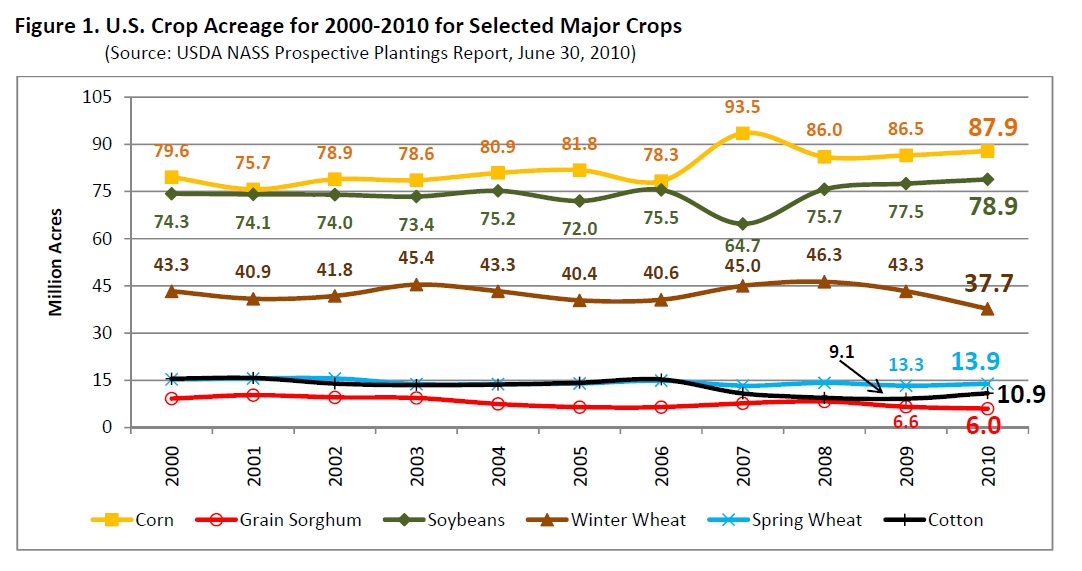
Corn Planted Acreage Down 2 Percent from 2014, 88.0 Million acres
Soybean Acreage Up 2 Percent, 85 Million acres
Wheat Acreage Down 1 Percent, 56.1 Million acres
Cotton Acreage Down 18 Percent, 9 Million acres
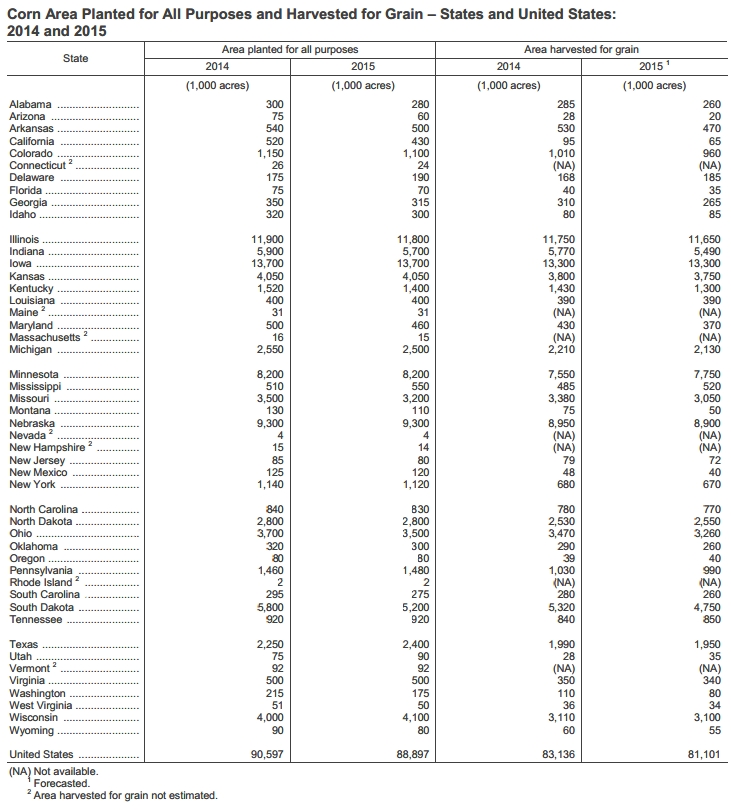
Corn planted area for all purposes in 2015 is estimated at 88.9 million acres, down 2 percent from last year. This represents the lowest planted acreage in the in the United States since 2010. Soybean planted area for 2015 is estimated at a record high 85.1 million acres, up 2 percent from last year. Area for harvest, at 84.4 million acres, is also up 2 percent from 2014 and will be record high, if realized. Record high planted acreage is estimated in Kentucky, Minnesota, Ohio, Pennsylvania, and Wisconsin. All wheat planted area for 2015 is estimated at 56.1 million acres, down 1 percent from 2014. The 2015 winter wheat planted area, at 40.6 million acres, is down 4 percent from last year and down less than 1 percent from the previous estimate. Of this total, about 29.6 million acres are Hard Red Winter, 7.61 million acres are Soft Red Winter, and 3.44 million acres are White Winter. Area planted to other spring wheat for 2015 is estimated at 13.5 million acres, up 4 percent from 2014. Of this total, about 12.6 million acres are Hard Red Spring wheat. Durum planted area for 2015 is estimated at 1.95 million acres, up 40 percent from the previous year. All cotton planted area for 2015 is estimated at 9.0 million acres, 18 percent below last year. Upland area is estimated at 8.85 million acres, down 18 percent from 2014. American Pima area is estimated at 148,000 acres, down 23 percent from 2014.
| Parameter | DRC | UGANDA | USA | Source |
| Population | 64,205,000 | 37,579,000 | 324,276,754 | FAO 2016 |
| Total land area in agriculture | 26,200,000 ha | 14,415,000 ha | 405,437,000 ha | FAO 2016 |
| Maize production/yr | 14,000 tonnes | 2,748,000 tonnes | 353,699,441 tonnes | FAO 2013 |
| Maize area | 13,750 ha | 1,000,000 ha | 35,478,012 ha | FAO 2013 |
| sorghum production/yr | 7600 tonnes | 299,000 ha | 9,881,788 tonnes | FAO 2013 |
| Sorghum area | 8400 ha | 350,000 ha | 2642600 ha | FAO 2013 |
| Other cereal production/yr | ||||
| Other cereal area | ||||
| Beef production/yr | 64,689 head | 1,336,147 head | 31,421,694head | FAO 2015 |
| Sheep/hairless sheep production/yr | 912,000 (2014) | 1,921,000(2014) | 5,245,000(2014) | FAO2015 |
| Other significant agric products | ||||
| Caloric intake/person/day | 2,150 kcal | 2,250 kcal | 3,770 kcal | 2005_07 |
| Starvation statistics | 1.4 million (2012) | 10.7 million(20120 | N/A | Nation master |
| Asia | Africa | ||||
| 2009 Maize | ha's | 2009 Maize | ha's | ||
| China | 30,478,998 | Kenya | 1,884,368 | ||
| India | 8,400,000 | Ethiopia | 1,768,122 | ||
| Indonesia | 4,160,659 | Angola | 1,554,096 | ||
| Philippines | 2,683,900 | Ghana | 954,400 | ||
| Thailand | 1,104,870 | Zambia | 911,942 | ||
| Vietnam | 1,086,800 | Uganda | 887,000 | ||
| Pakistan | 950,000 | Egypt | 835,000 | ||
| Nepal | 875,428 | Cameroon | 620,000 | ||
| 2009 Rice | ha's | 2009 Rice | ha's | ||
| India | 44,100,000 | Mali | 845,552 | ||
| China | 29,932,292 | Egypt | 750,000 | ||
| Indonesia | 12,883,576 | Ghana | 162,400 | ||
| Bangladesh | 11,500,000 | Senegal | 139,388 | ||
| Thailand | 10,963,126 | Uganda | 138,000 | ||
| Viet Nam | 7,440,100 | Gambia | 73,000 | ||
| Philippines | 4,532,300 | Cameroon | 50,000 | ||
| Pakistan | 2,883,000 | ||||
| Cambodia | 2,675,000 | ||||
| 2009 Wheat | ha's | 2009 Wheat | ha's | ||
| India | 28,400,000 | Algeria | 1,848,575 | ||
| China | 24,210,075 | Ethiopia | 1,453,817 | ||
| Kazakhstan | 14,329,400 | Egypt | 1,321,751 | ||
| Pakistan | 9,046,000 | South Africa | 642,500 | ||
| Turkey | 8,026,898 | Sudan | 400,000 | ||
| Iran | 6,647,367 | Kenya | 127,410 | ||
| Afghanistan | 2,500,000 | ||||
|
|
|||||
-
Corn Acreage USA 2010
Corn Acreage: 89,252,000 acres
Production: 13.1 billion bushels (4.2 billion for ethanol)
153 bu/ac
$4.00 /bu - Wheat Acreage:
53,800,000 acres
Production: 2.17 billion bushels
42.5 bu/ac
$5.30 /bu
-
Soybean Acreage: 78,161,000
acres
Production: 2.88 billion bushels
41.5 bu/ac
$10.10 /bu
- US Nutrient Use 2009
12.05 million tons N
4.5 million tons P2O5
4.7 million tons K2O
Average USA corn yield: 130 bu/ac
Corn Acres Harvested: 69.1 million acres
Corn Production USA: 9.0 billion bushels
| 2009 World Production, Mt | |||
| Corn | Soybeans | Wheat | |
| USA | 333010910 | 91417300 | 60314290 |
| China | 163118097 | 14500141 | 114950296 |
| Brazil | 51232447 | 56960732 | 4964665 |
| Mexico | 20202600 | 120900 | 4148000 |
| Argentina | 13121380 | 30993379 | 7573254 |
| India | 17300000 | 10217000 | 80680000 |