 Experiment 222: Long-Term Application of N, P, and K in Continuous Winter
Wheat, est. 1968
Experiment 222: Long-Term Application of N, P, and K in Continuous Winter
Wheat, est. 1968GPS Coordinates:
36.122056, -97.091259
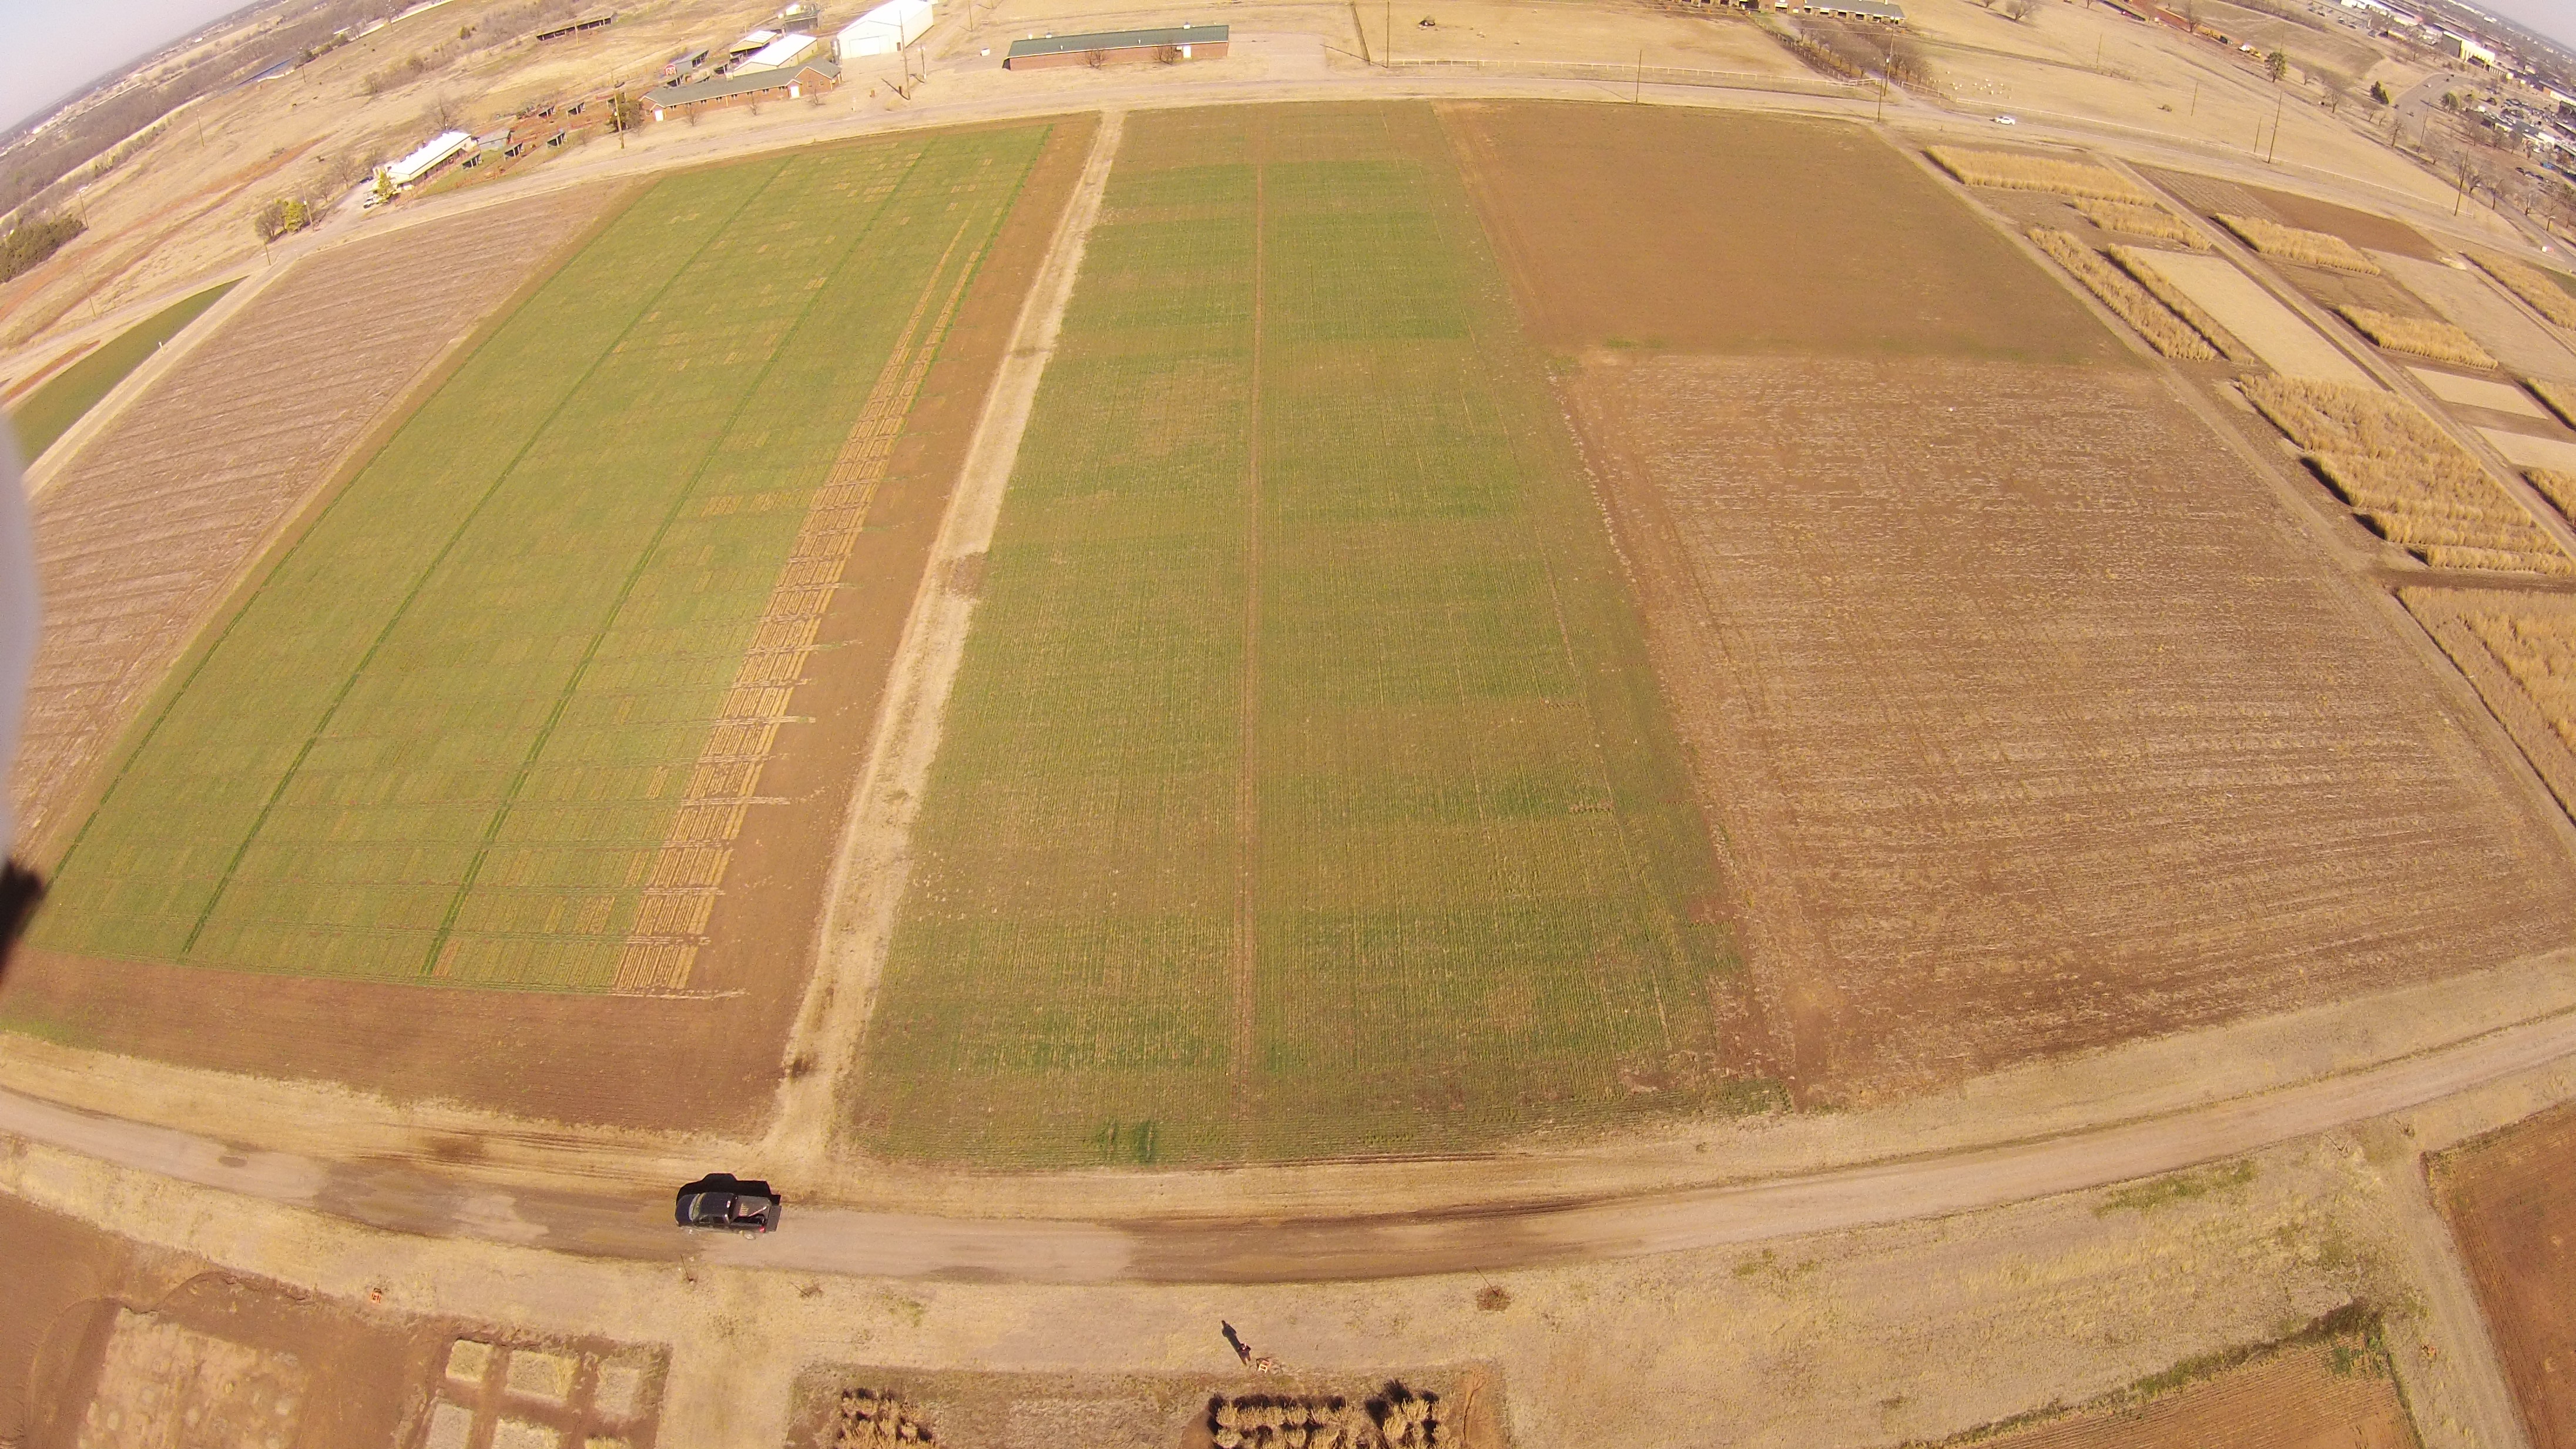
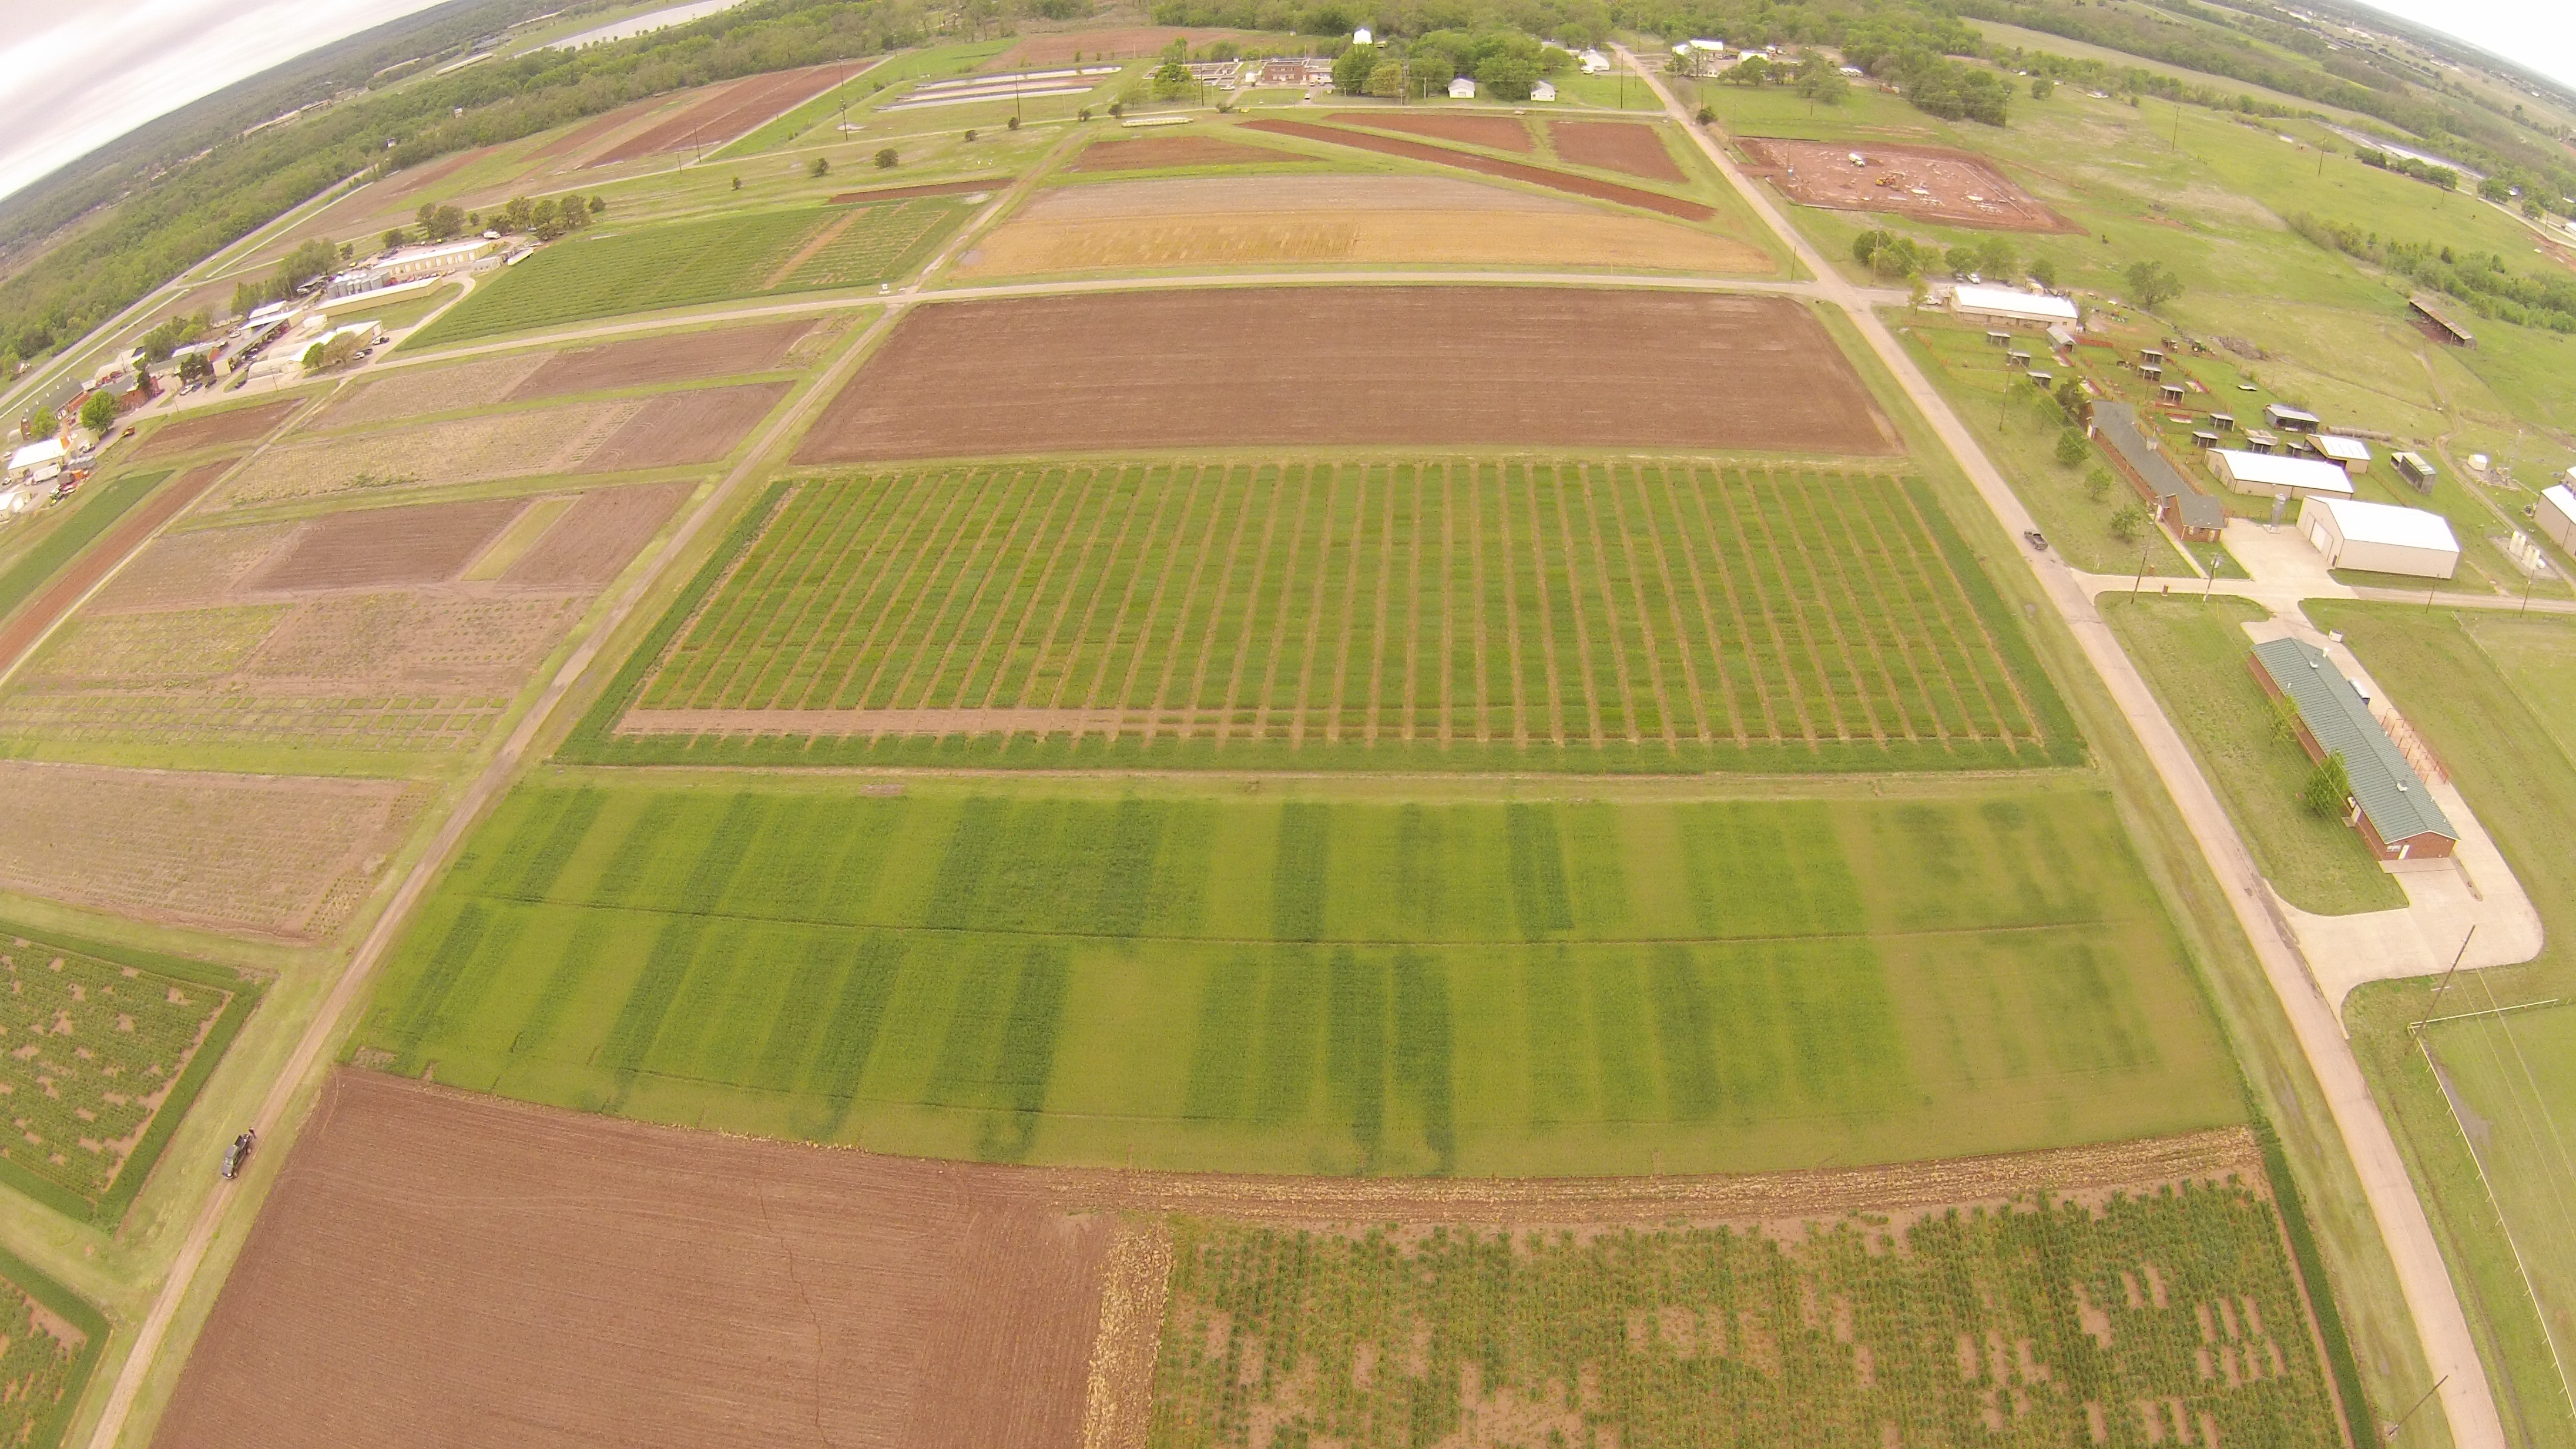
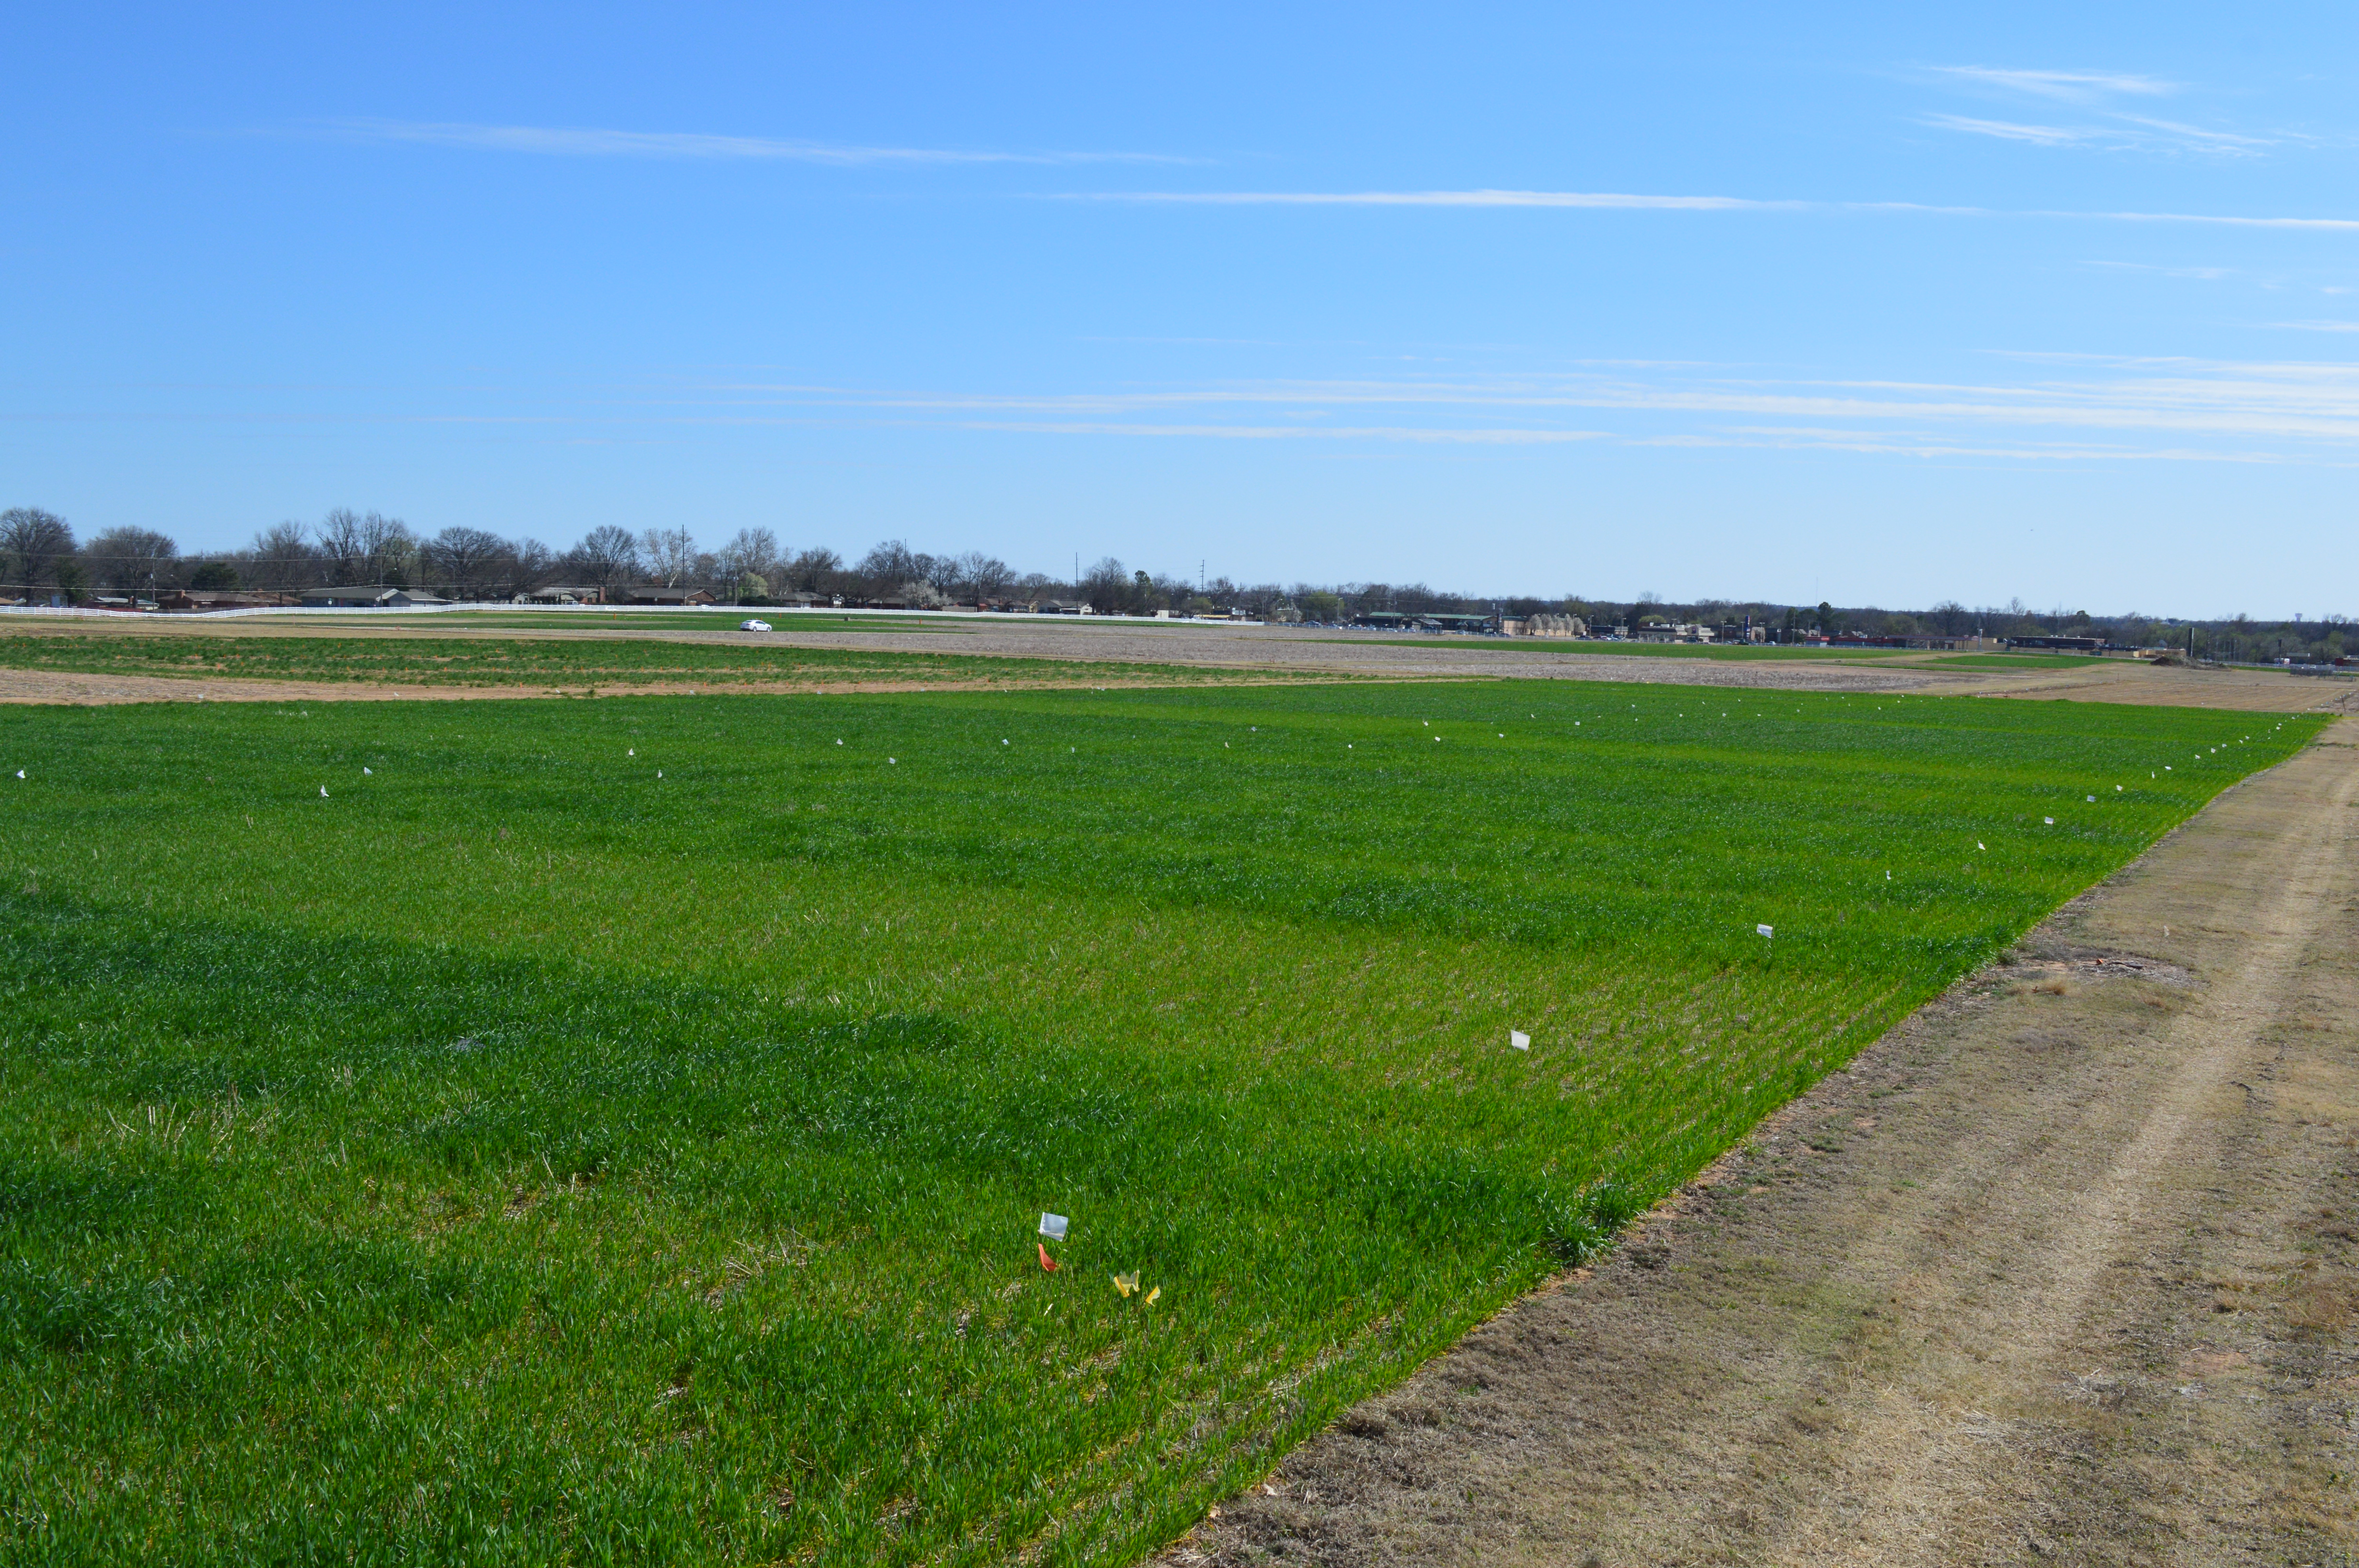
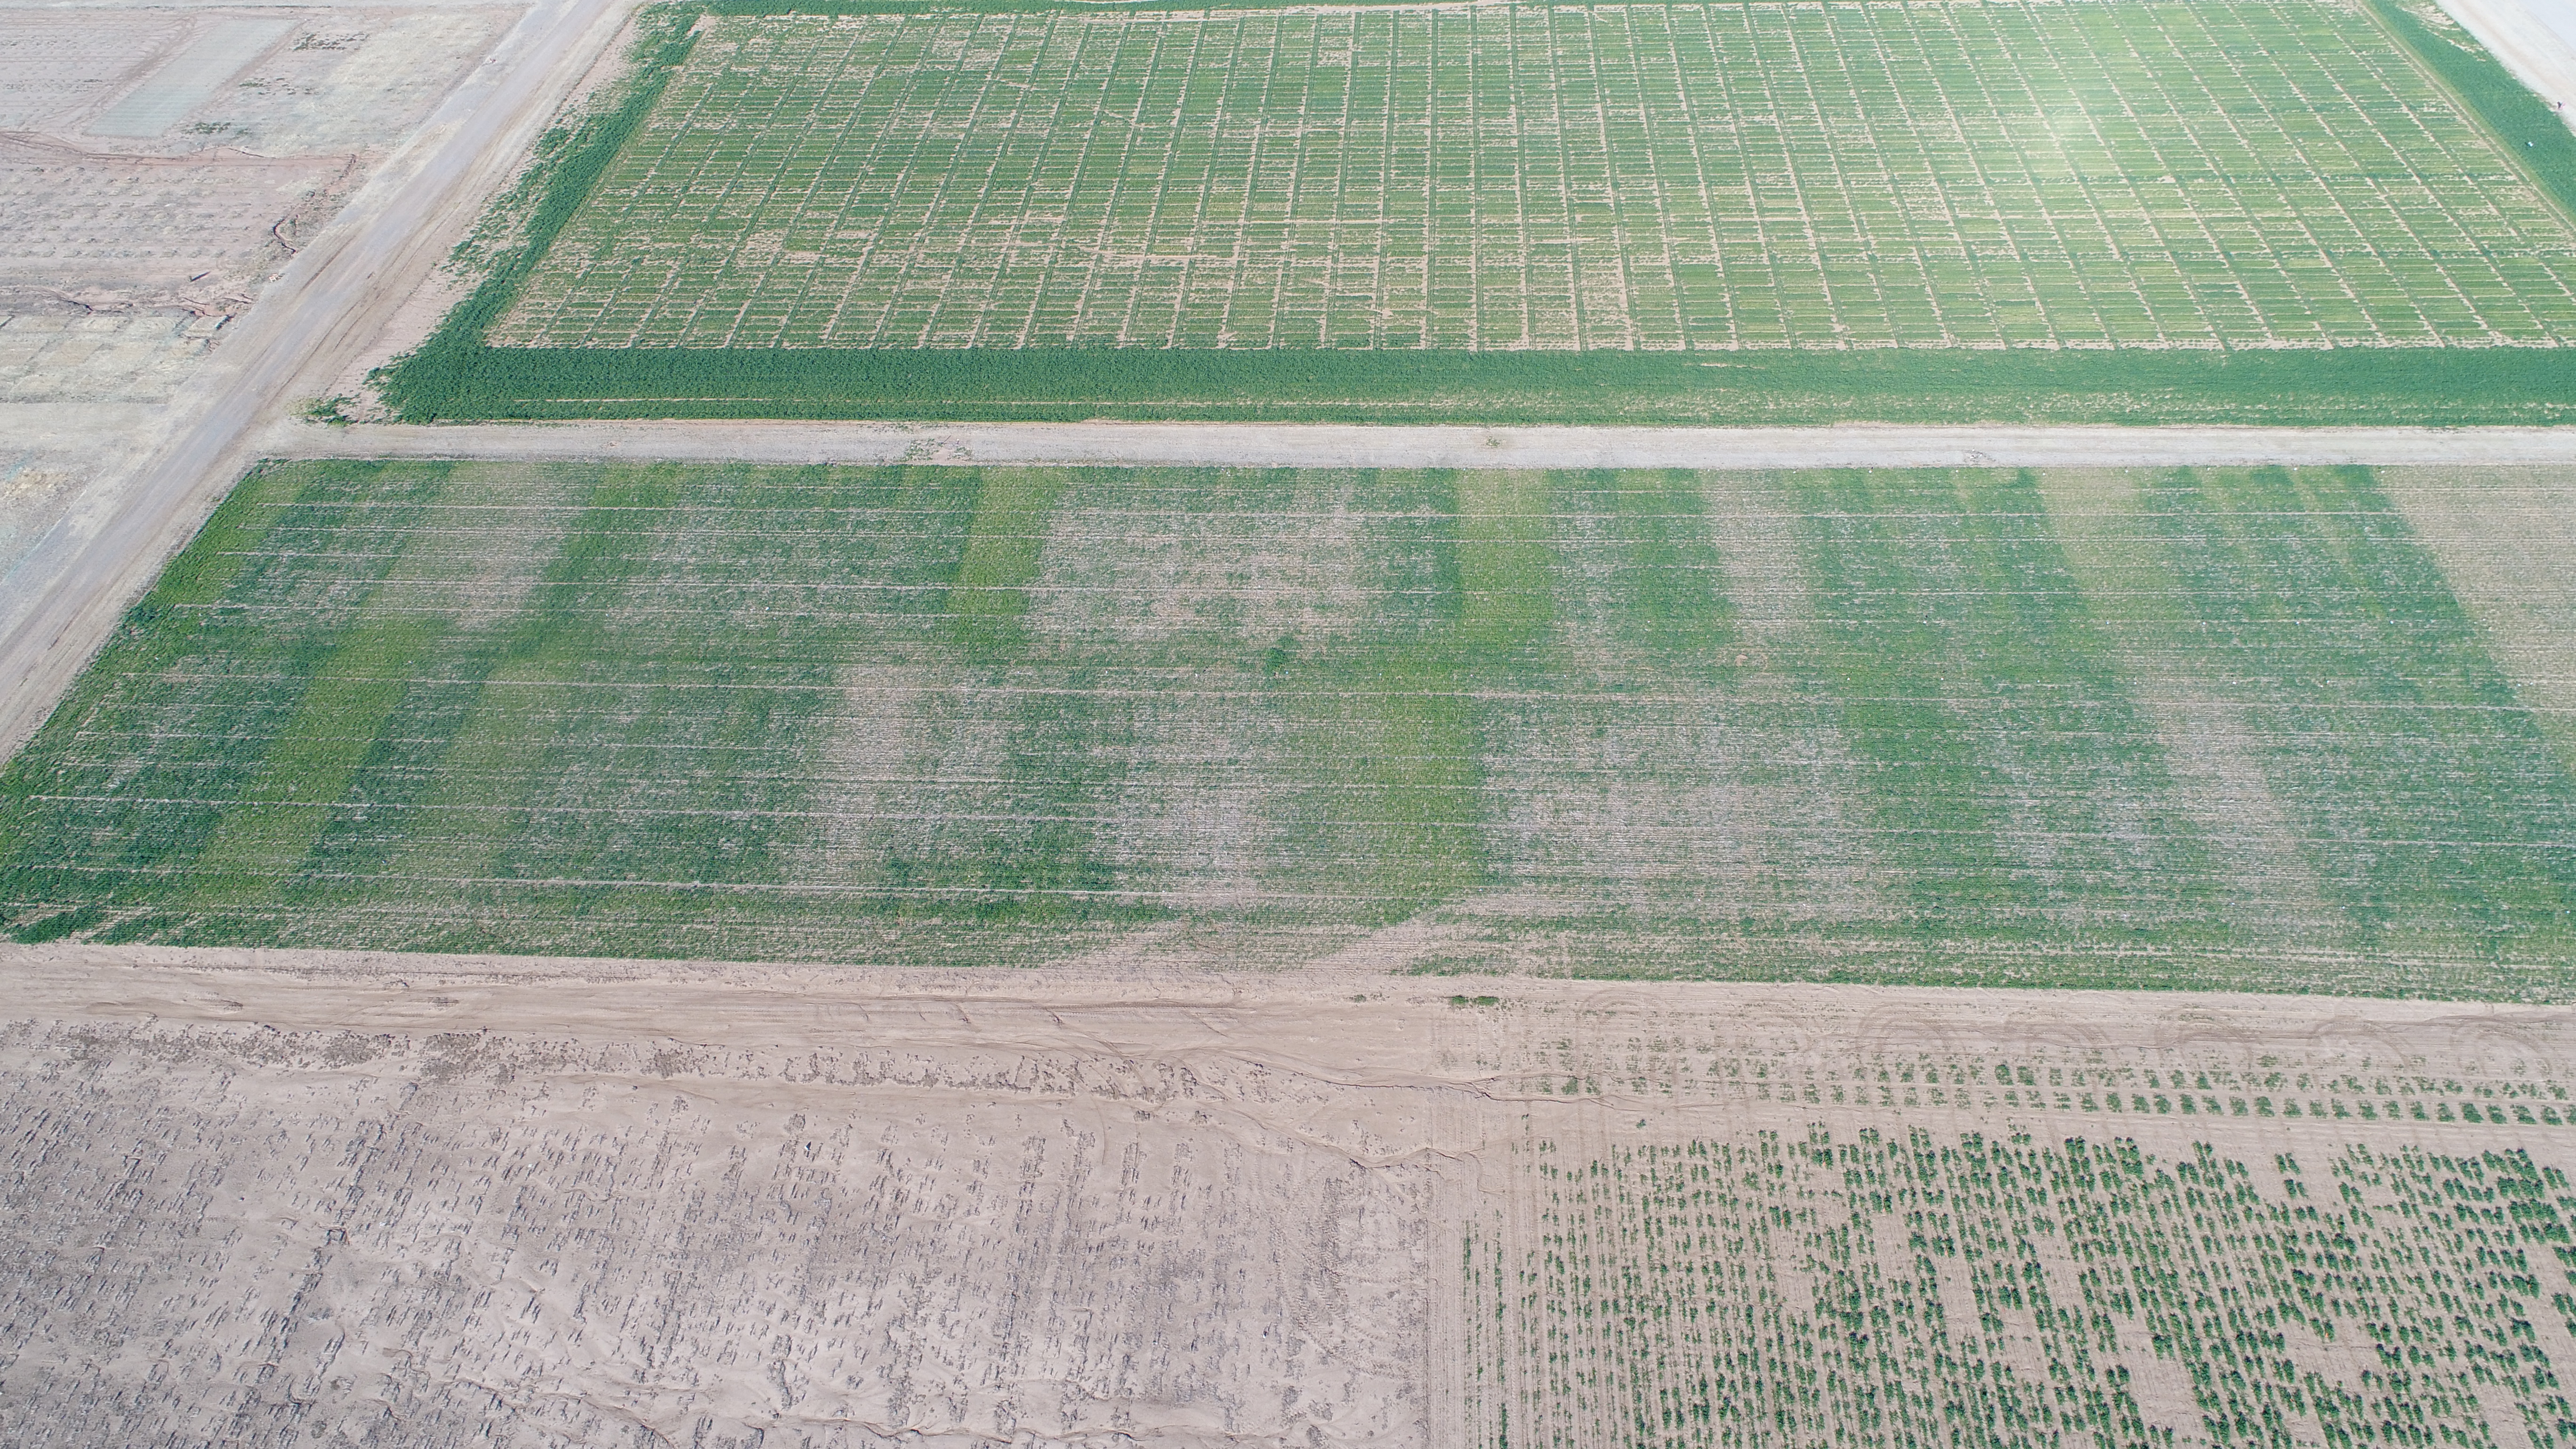
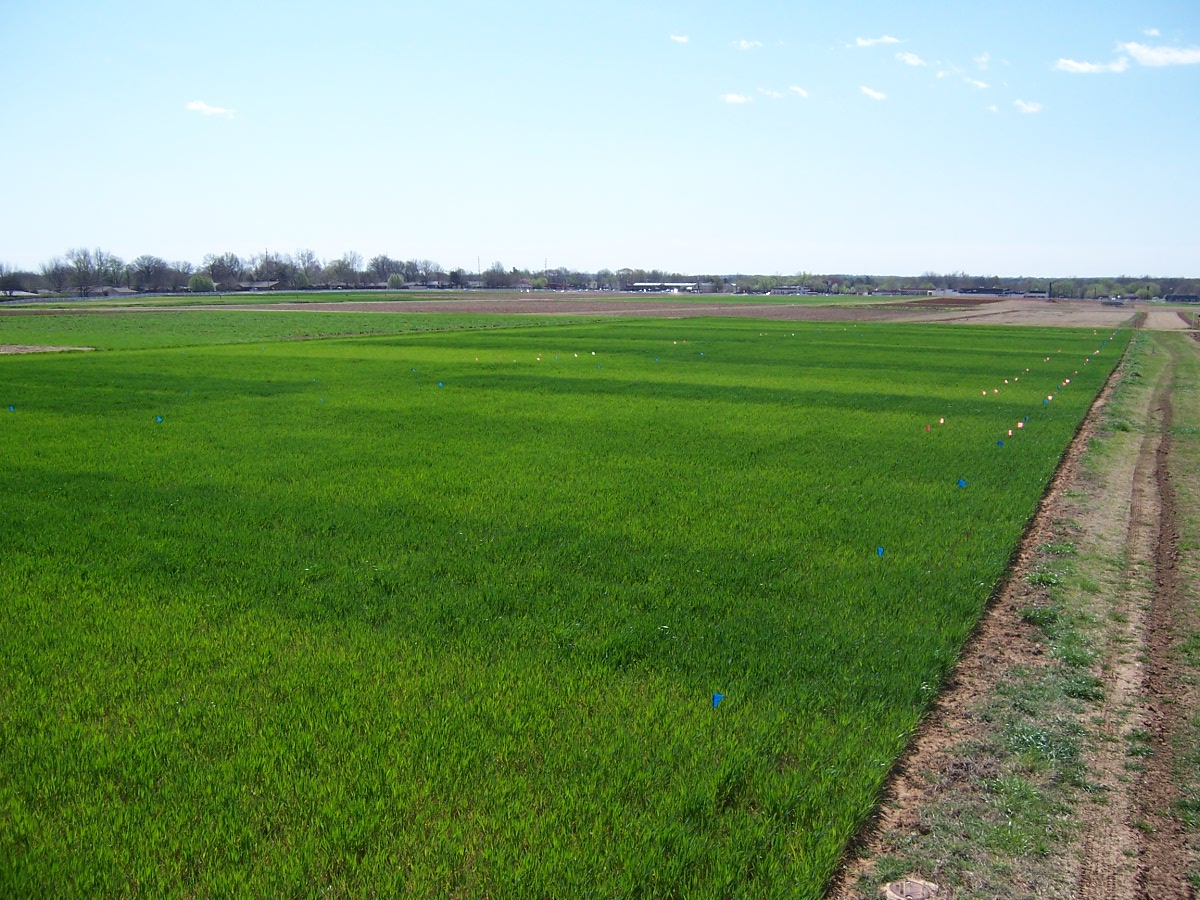
Experiment 222, May 1, 2020
Experiment 222, February 5, 2016
E222_14.xlsx (Long Term Data Base)
E222_15.xlsx (9/14/2015)

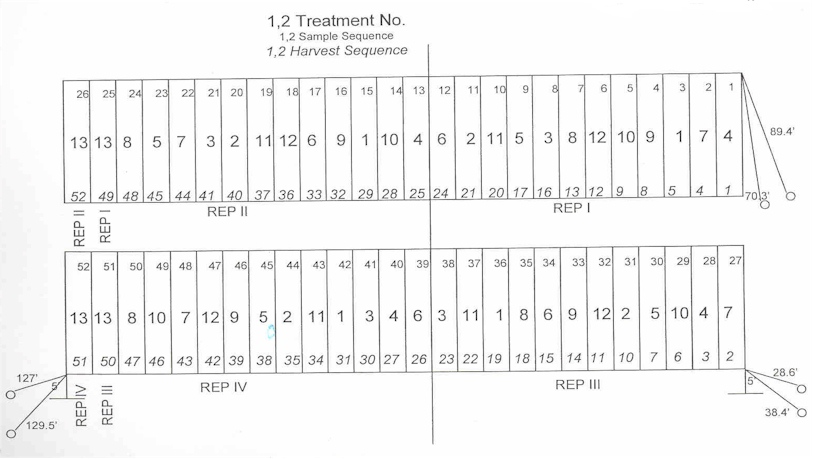
 PLOT PLAN (ppt file)

| Avg. | Std Dev | |||
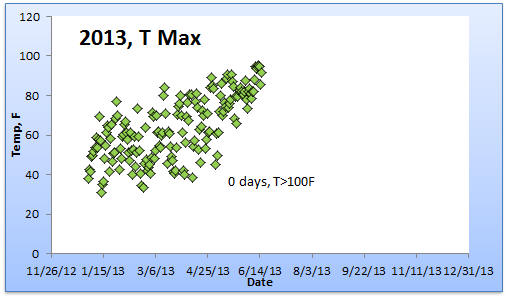
| Days, >100 F | 52 | 2011 | 74.44 | 21.92 |
| 27 | 2012 | 75.72 | 17.80 | |
| Days, >90 F | 106 | 2011 | 74.44 | 21.92 |
| 88 | 2012 | 75.72 | 17.80 |

Abstract
In 1968, experiment #222
was initiated at the Agronomy Research Station in Stillwater, Oklahoma.
This trial was established to evaluate long-term winter wheat grain
yield response to applied nitrogen (N), phosphorus (P) and potassium (K).
Applications of sulfur (S) and magnesium (Mg) (Sul-Po-Mag) were
also compared. In the first
decade of the experiment, few responses to applied N, P and/or K were
found. Following twenty years
without fertilization, average check plot yields were 20 bu/ac.
It was not until the third decade of this experiment that a
dramatic response to applied N was observed.
A tendency for increased yields with applied P and K (5 vs 6 and 8
vs 9) was present for the 1989-98 time period, but, this was not
significant. Over the 31
years that these treatments have been evaluated, only applied N has
produced a significant increase in grain yields.
In many regards this continuous wheat data demonstrates the
difficulty of evaluating P and K fertilizers since no response could be
induced without fertilization following 31 years.
Nitrogen applied at an annual rate of 80 pounds per acre was
adequate to produce near maximum yields in all three decades evaluated.
Considering these results it can also be concluded that if there was no
response to applied K (as KCl), there would also be no response to applied
Cl. Also, no response was
seen to applied S and/or Mg as K,MgSO4.
Grain %N increased with increasing rates of applied N in all three
decades evaluated.
Materials and Methods
Experiment #222 was established in 1969 under conventional tillage on a Kirkland silt loam (fine, mixed, thermic Udertic Paleustoll). Wheat was planted for 22 continuous years in 10-inch rows at seeding rates of 60 pounds per acre. Since 1992, winter wheat has been planted in 7.5-inch rows. The variety 'Scout 66' was planted from 1968-73, 'Triumph 64' from 1974-1977, 'Osage' from 1978-80 and 'TAM W-101' from 1981-91, 'Karl' from 1992-1994, 'Tonkawa' from 1995 to 1998 and ‘Custer’ since 1999. Changes in management, fertilization and application dates are reported in Table 1. The experimental design employed was a randomized complete block with four replications. Fertilizer treatments used in this experiment and average grain yield means over selected periods are reported in Table 2. Surface soil (0-6 inches) test analyses from samples collected in 1995 are also reported in Table 2. Individual plots at this site are 20 feet wide and 60 ft long. The center 10 feet (1969-1995) and 6 ft (1996-present) of each plot was harvested with a conventional combine the entire 60 ft in length for yield. In addition to wheat grain yield measured every year from this experiment, periodic soil and grain samples were taken for further chemical analyses.
A significant response to applied N was not seen until the second decade of the experiment (Table 2, 1979-1988). Since that time, applied N has resulted in significant yield increases. Other than applied N, limited response to applied P or K has been found in this experiment. However, a recent trend for increased yields as a result of applying K has been observed, especially at the high rates of applied N. Considering these results it can also be concluded that if there was no consistent response to applied K (as KCl), there would also be no response to applied Cl. Also, no response was seen to applied S and/or Mg as K,MgSO4 (treatment 13 versus 3).
The fertilizer treatments
evaluated have resulted in relatively small surface soil pH (0-6 inches)
changes following 27 years (1969-1995) of continuous winter wheat.
Soil test P declined with increasing applied N, a result of
increased depletion. Surface
soil organic matter levels have not changed dramatically, however, organic
matter levels have increased at the high N rates when compared to the 0 N
checks.
References
Ranney, R.W. 1969. An
organic carbon-organic matter conversion equation for Pennsylvania surface
soils. Soil Sci. Soc. Amer. Proc. 33:809-811.
Table 1. Treatment applications, and experimental management for continuous winter wheat Experiment 222, Stillwater, OK, 1969-2015.
| Year | Variety | Fert App | Planting | Harvest Date | Seeding Rate | Topdress |
| Date | Date | Date | ||||
| 1969 | Scout 66 | 60 | ||||
| 1970 | Scout 66 | 60 | ||||
| 1971 | Scout 66 | 60 | ||||
| 1972 | Scout 66 | 60 | ||||
| 1973 | Scout 66 | 10/3/1972 | 10/9/1972 | 60 | 3/16/1973 | |
| 1974 | Triumph 64 | 60 | ||||
| 1975 | Triumph 63 | 8/29/1975 | 60 | |||
| 1976 | Triumph 64 | 60 | ||||
| 1977 | Triumph 64 | 6/15/1977 | 60 | |||
| 1978 | Osage | 9/9/1977 | 6/14/1978 | 60 | 3/29/1978 | |
| 1979 | Osage | 6/29/1979 | 60 | |||
| 1980 | Osage | 6/25/1980 | 60 | |||
| 1981 | TAM W-101 | 6-31-81 | 72 | |||
| 1982 | TAM W-101 | 9/18/1981 | 9/22/1981 | 6/14/1982 | 60 | |
| 1983 | TAM W-101 | 9/29/1982 | 6/21/1983 | 90 | 3/1/1983 | |
| 1984 | TAM W-101 | 8/31/1983 | 10/5/1983 | 6/25/1984 | 72 | |
| 1985 | TAM W-101 | 8/23/1984 | 10/2/1984 | 6/12/1985 | 72 | 3/8/1985 |
| 1986 | TAM W-101 | 10/7/1985 | 6/12/1986 | 72 | 2/18/1986 | |
| 1987 | TAM W-101 | 8/20/1986 | 10/17/1986 | 6/15/1987 | 72 | 3/6/1987 |
| 1988 | TAM W-101 | 9/17/1987 | 6/14/1988 | 72 | ||
| 1989 | TAM W-101 | 8/18/1988 | 6/20/1989 | 60 | ||
| 1990 | TAM W-101 | 8/29/1989 | 10/11/1989 | 6/13/1990 | 60 | |
| 1991 | TAM W-101 | 60 | ||||
| 1992 | TAM W-101 | 9/10/1991 | 9/30/1991 | 6/17/1992 | 75 | 2/3/1992 |
| 1993 | Karl | 9/16/1992 | 10/12/1992 | 6/17/1993 | 95 | 2/3/1993 |
| 1994 | Karl | 9/22/1993 | 9/27/1993 | 6/8/1994 | 95 | |
| 1995 | Tonkawa | 8/30/1994 | 9/29/1994 | 6/20/1995 | 90 | 2/24/1995 |
| 1996 | Tonkawa | 10/9/1995 | 10/10/1995 | 6/11/1996 | 70 | 3/13/1996 |
| 1997 | Tonkawa | 9/5/1996 | 10/3/1996 | 6/19/1997 | 70 | 2/17/1997 |
| 1998 | Tonkawa | 9/29/1997 | 10/3/1997 | 6/10/1998 | 68 | 1/30/1998 |
| 1999 | Tonkawa | 9/3/1998 | 10/13/1998 | 6/15/1999 | 68 | 2/15/1999 |
| 2000 | Custer | 9/5/1999 | 10/7/1999 | 7/6/2000 | 68 | 2/17/2000 |
| 2001 | Custer | 11/20/2000 | 6/12/2001 | |||
| 2002 | Custer | 10/1/2001 | 3/3/2002 | |||
| 2003 | Custer | 10/14/2002 | 6/23/2003 | |||
| 2004 | Custer | 10/6/2003 | 6/16/2004 | |||
| 2005 | P2174 | 10/21/2004 | 6/7/2005 | |||
| 2006 | Endurance | 1/7/2005 | 5/26/2006 | |||
| 2007 | Endurance | 1/3/2006 | 6/8/2007 | |||
| 2008 | OKField | 10/9/2007 | ||||
| 2009 | OKField | 9/16/2008 | 6/25/2008 | 3/9/2009 | ||
| 2010 | GoLead | 10/1/2009 | 3/3/2010 | 6/29/2010 | 90 | 2/22/2011 |
| 2011 | Centerfield | 9/1/2010 | 9/30/2010 | 6/9/2011 | ||
| 2012 | Endurance | 9/15/2011 | 10/13/2011 | 6/8/2012 | 90 | 3/7/2012 |
| 2013 | OK9935C | 9/26/2012 | 11/16/2012 | 6/28/2013 | 3/11/2013 | |
| 2014 | Doublestop-CL | 10/10/2013 | 10/22/2013 | 6/18/2014 | 75 | 3/21/2014 |
| 2015 | Iba | 9/26/2014 | 10/20/2014 | 6/8/2015 | 75 | 3/16/2015 |
Table 2.
Soil fertility treatment effects on wheat grain yields, Experiment
#222, Stillwater, OK 1969-2000, and surface (0-6 inches) soil test results
from 1995.
|
|
|
|
Year
Period |
Soil Test (1995) |
|||||||
|
Treatment |
|
|
|
|
|
|
99-00 |
|
|
|
|
|
|
N |
P2O5 |
K2O |
|
|
|
|
|
|
|
OM |
|
|
|
lb/ac |
|
|
|
|
% |
||||
|
1. |
0 |
60 |
40 |
25.3 |
19.2 |
12.8 |
14.9 |
18.3 |
5.85 |
50 |
2.27 |
|
2. |
40 |
60 |
40 |
27.9 |
27.2 |
18.0 |
22.1 |
23.9 |
5.83 |
37 |
2.35 |
|
3. |
80 |
60 |
40 |
28.5 |
28.6 |
21.8 |
30.4 |
26.4 |
5.50 |
34 |
2.27 |
|
4. |
120 |
60 |
40 |
26.7 |
31.2 |
25.2 |
30.3 |
27.9 |
5.72 |
26 |
2.37 |
|
5. |
80 |
0 |
40 |
25.0 |
27.2 |
23.3 |
32.9 |
25.7 |
5.59 |
14 |
2.20 |
|
6. |
80 |
30 |
40 |
25.0 |
31.6 |
25.1 |
32.9 |
27.8 |
5.48 |
23 |
2.25 |
|
7. |
80 |
90 |
40 |
29.1 |
28.4 |
20.5 |
27.1 |
25.8 |
5.54 |
50 |
2.30 |
|
8. |
80 |
60 |
0 |
25.5 |
27.7 |
20.8 |
28.8 |
24.9 |
5.67 |
32 |
2.27 |
|
9. |
80 |
60 |
80 |
27.3 |
29.9 |
22.4 |
30.1 |
26.7 |
5.55 |
38 |
2.24 |
|
10. |
0 |
0 |
0 |
23.7 |
20.1 |
12.7 |
12.3 |
18.0 |
5.93 |
16 |
2.13 |
|
11. |
120 |
90 |
80 |
27.6 |
30.7 |
26.3 |
34.7 |
28.7 |
5.73 |
40 |
2.27 |
|
12. |
120 |
90 |
0 |
24.5 |
27.9 |
23.7 |
30.2 |
25.8 |
5.91 |
38 |
2.20 |
|
13. |
80 |
60 |
40* |
32.3 |
27.4 |
21.4 |
28.6 |
25.9 |
5.89 |
26 |
2.23 |
|
|
|
|
|
|
|
|
|
|
|
|
|
|
Mean |
|
|
|
26.6 |
27.5 |
21.1 |
27.3 |
25.0 |
5.73 |
33 |
2.26 |
|
SED |
|
|
|
3.1 |
2.8 |
2.0 |
4.8 |
2.7 |
0.15 |
8 |
0.11 |
|
CV,
% |
|
|
|
17 |
15 |
13 |
25 |
15 |
3.7 |
32 |
7 |
N, P2O5, and K2O applied as ammonium nitrate (34-0-0), triple superphosphate (0-46-0) and potassium chloride (0-0-60), respectively. *- K2O applied as sul-po-mag (0-0-22). SED standard error of the difference between two equally replicated means. CV coefficient of variation. pH 1:1 soil:water, P, Mehlich III extraction, OM = organic matter = OC*1.8+0.35 (Ranney, 1969)
Table 3.
Soil fertility treatment effects on wheat grain %N, Experiment
#222, Stillwater, OK 1969-2000.
|
|
|
|
|
Year Period |
||||
|
Treatment |
|
|
|
69-78 |
79-88 |
89-98 |
99-00 |
1969-2000 |
|
|
N |
P2O5 |
K2O |
|
|
|
|
|
|
|
|
lb/ac |
|
%
N |
||||
|
1. |
0 |
60 |
40 |
1.99 |
2.01 |
2.30 |
2.22 |
2.12 |
|
2. |
40 |
60 |
40 |
2.06 |
2.08 |
2.37 |
2.28 |
2.19 |
|
3. |
80 |
60 |
40 |
2.14 |
2.26 |
2.69 |
2.46 |
2.40 |
|
4. |
120 |
60 |
40 |
2.58 |
2.46 |
2.76 |
2.60 |
2.59 |
|
5. |
80 |
0 |
40 |
2.33 |
2.39 |
2.51 |
2.47 |
2.40 |
|
6. |
80 |
30 |
40 |
2.31 |
2.26 |
2.62 |
2.45 |
2.32 |
|
7. |
80 |
90 |
40 |
2.24 |
2.34 |
2.62 |
2.41 |
2.36 |
|
8. |
80 |
60 |
0 |
2.24 |
2.35 |
2.56 |
2.46 |
2.36 |
|
9. |
80 |
60 |
80 |
2.23 |
2.27 |
2.56 |
2.48 |
2.31 |
|
10. |
0 |
0 |
0 |
2.14 |
2.08 |
2.00 |
2.19 |
2.09 |
|
11. |
120 |
90 |
80 |
2.55 |
2.43 |
2.75 |
2.71 |
2.51 |
|
12. |
120 |
90 |
0 |
2.58 |
2.50 |
2.70 |
2.63 |
2.54 |
|
13. |
80 |
60 |
40* |
2.15 |
2.25 |
2.54 |
2.37 |
2.27 |
|
|
||||||||
|
Mean |
|
|
|
2.27 |
2.28 |
2.53 |
2.44 |
2.34 |
|
SED |
|
|
|
0.17 |
0.12 |
0.15 |
0.11 |
0.14 |
|
CV,
% |
|
|
|
10 |
8 |
8 |
6 |
8 |
N, P2O5, and K2O applied as ammonium nitrate (34-0-0), triple superphosphate ( 0-46-0) and potassium chloride (0-0-60), respectively. *- K2O applied as sul-po-mag (0-0-22). SED standard error of the difference between two equally replicated means. CV coefficient of variation. pH 1:1 soil:water, P, Mehlich III extraction, OM = organic matter = OC*1.8+0.35 (Ranney, 1969)
<----- NORTH
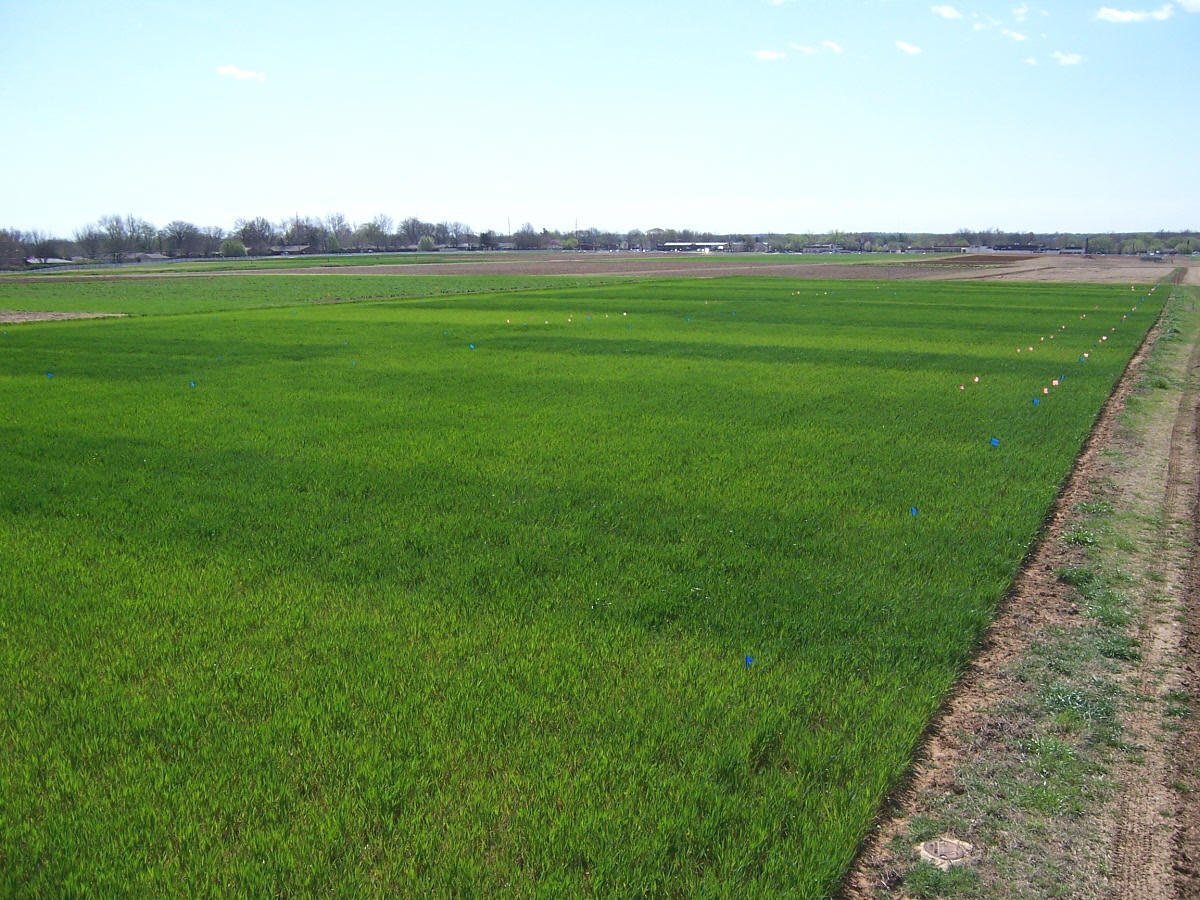
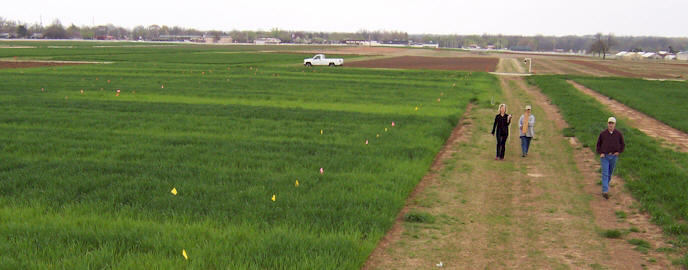
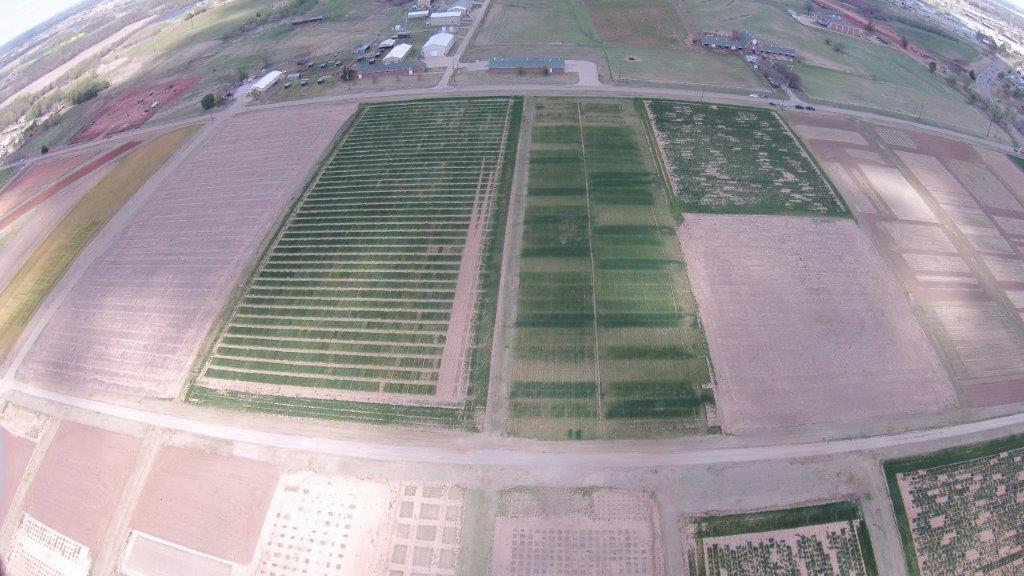
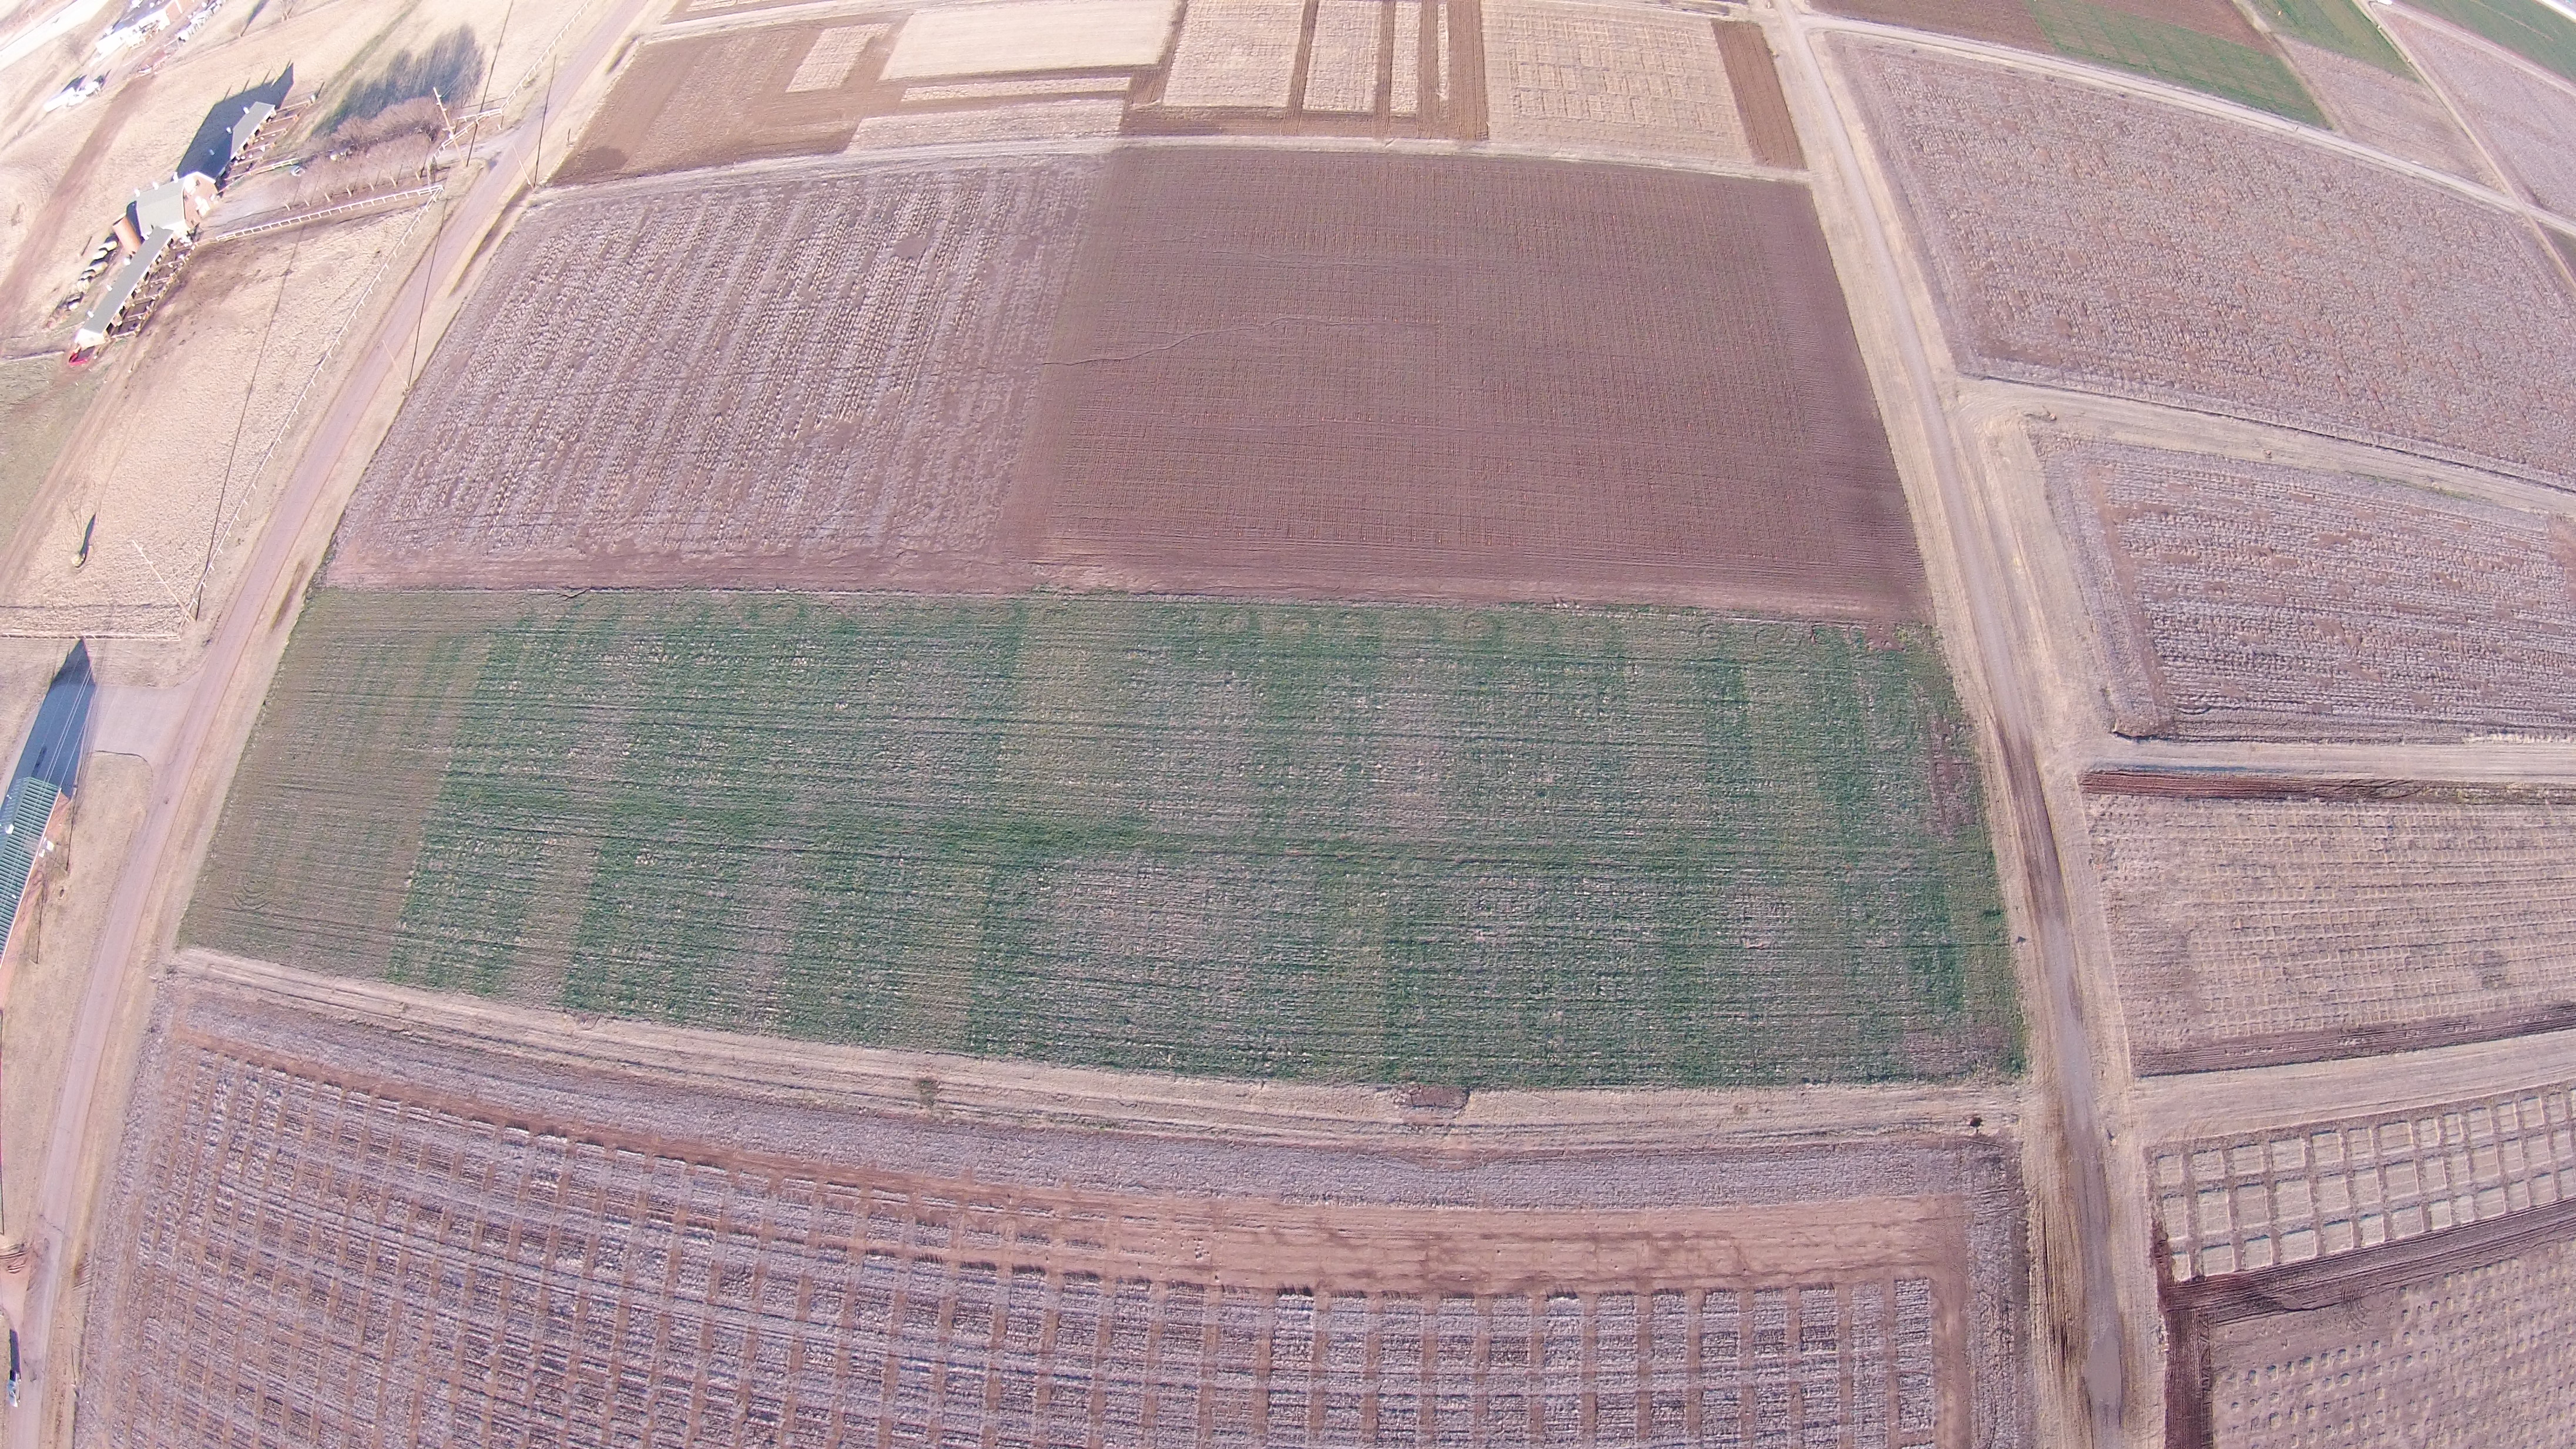
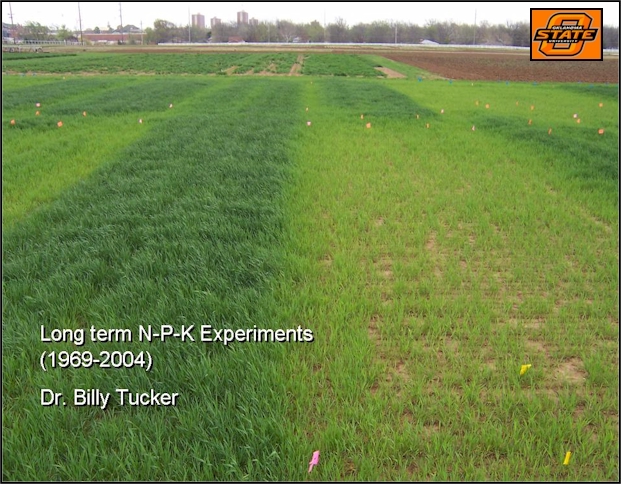
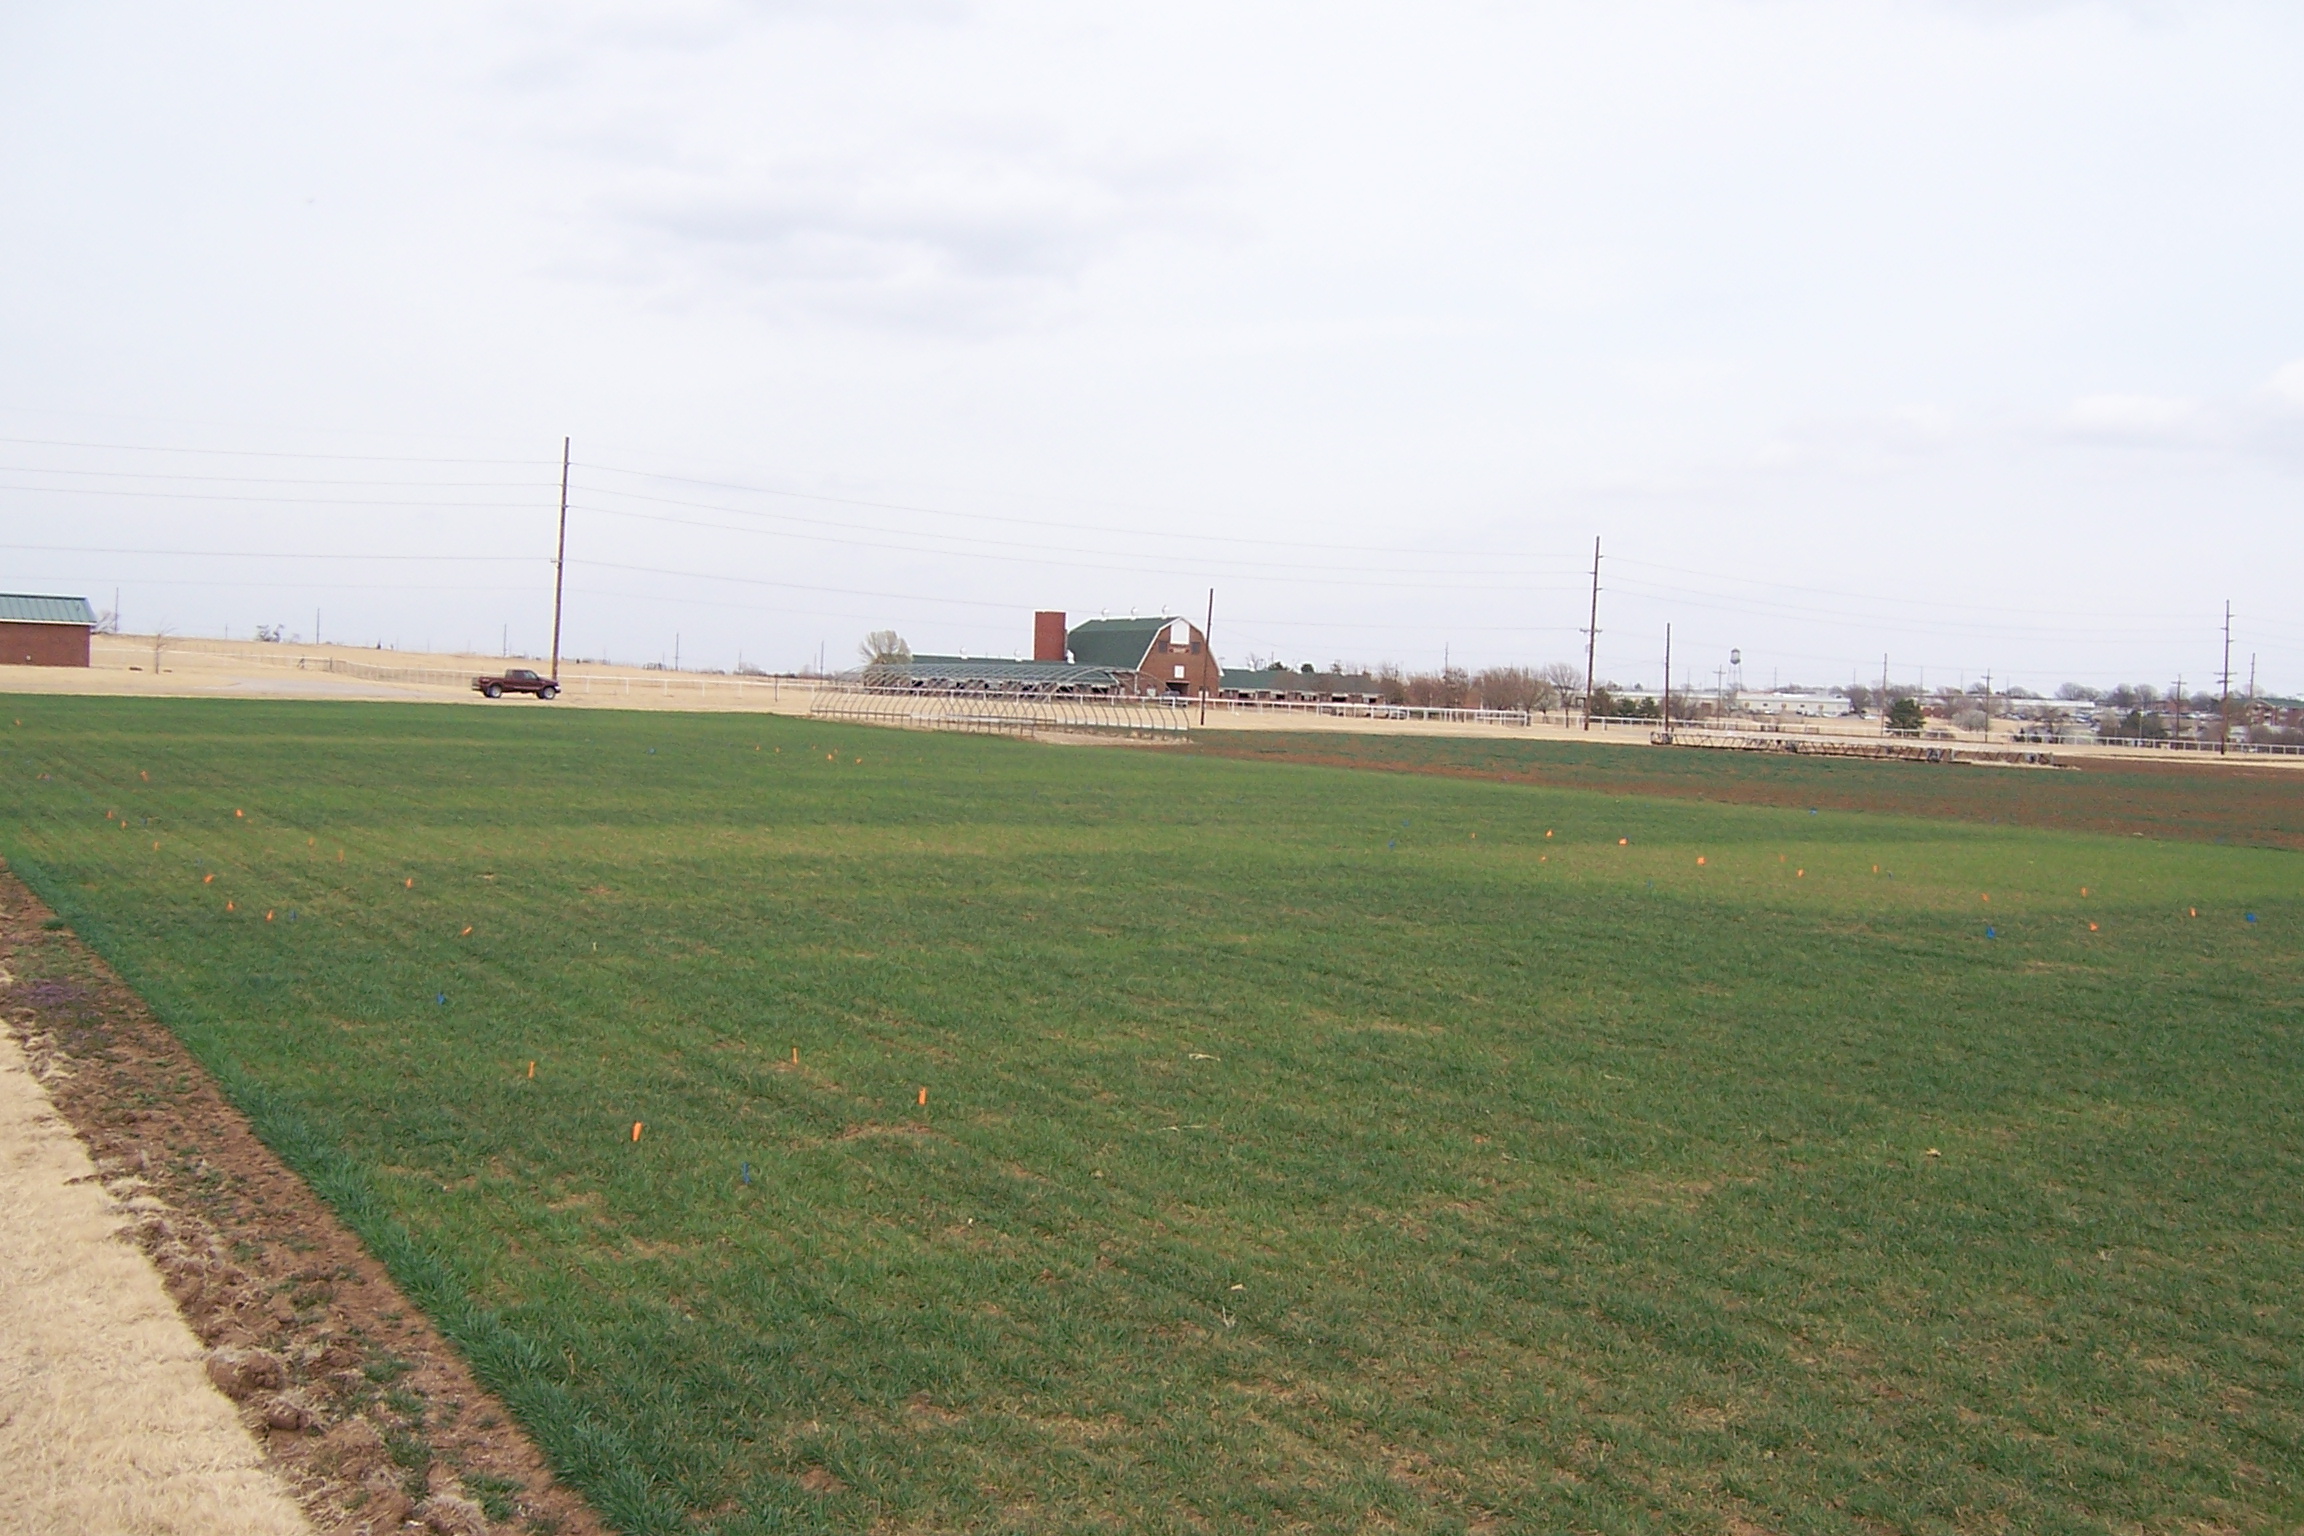
View of Experiment #222 looking south east, April 2005
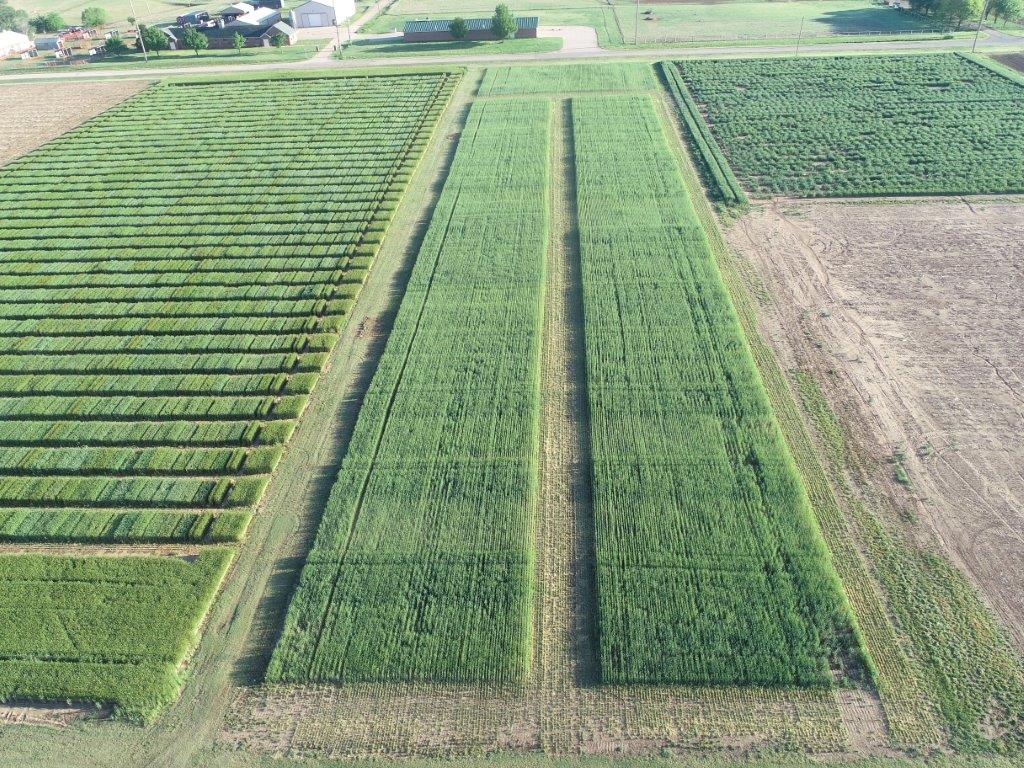
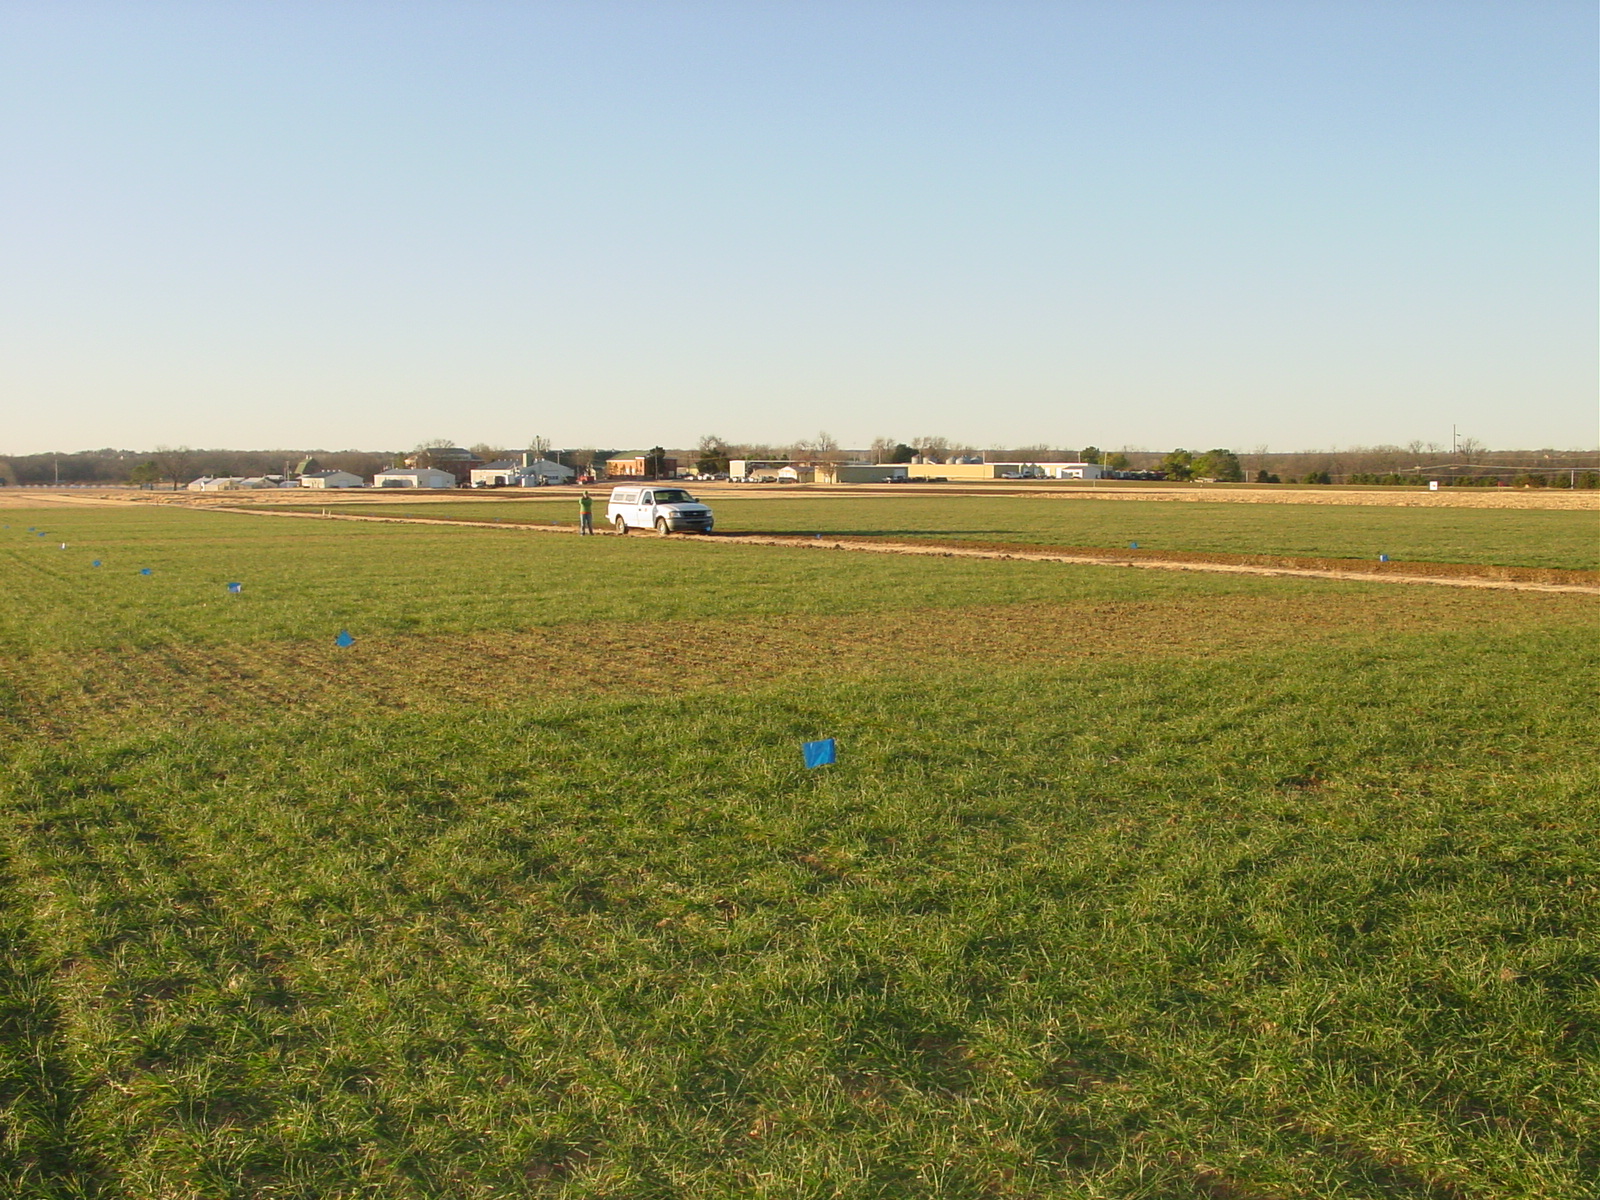
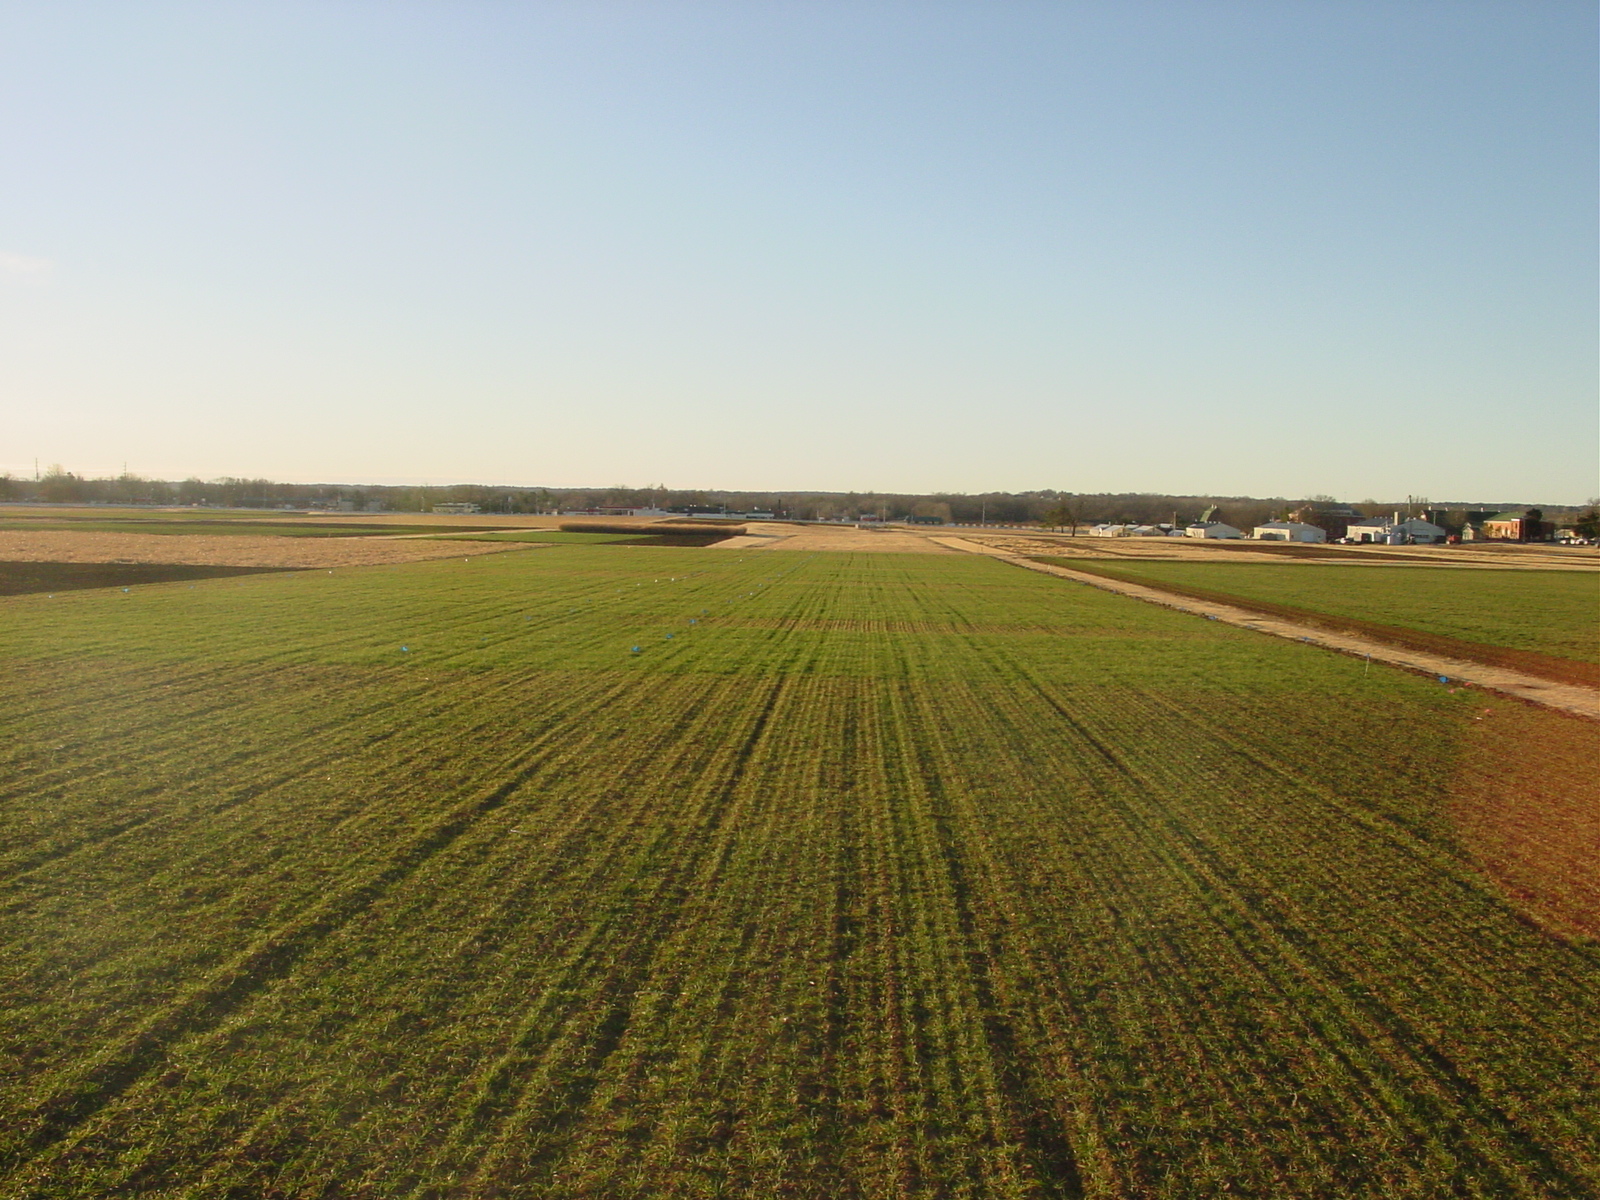
View of Experiment #222 looking south, January 2006
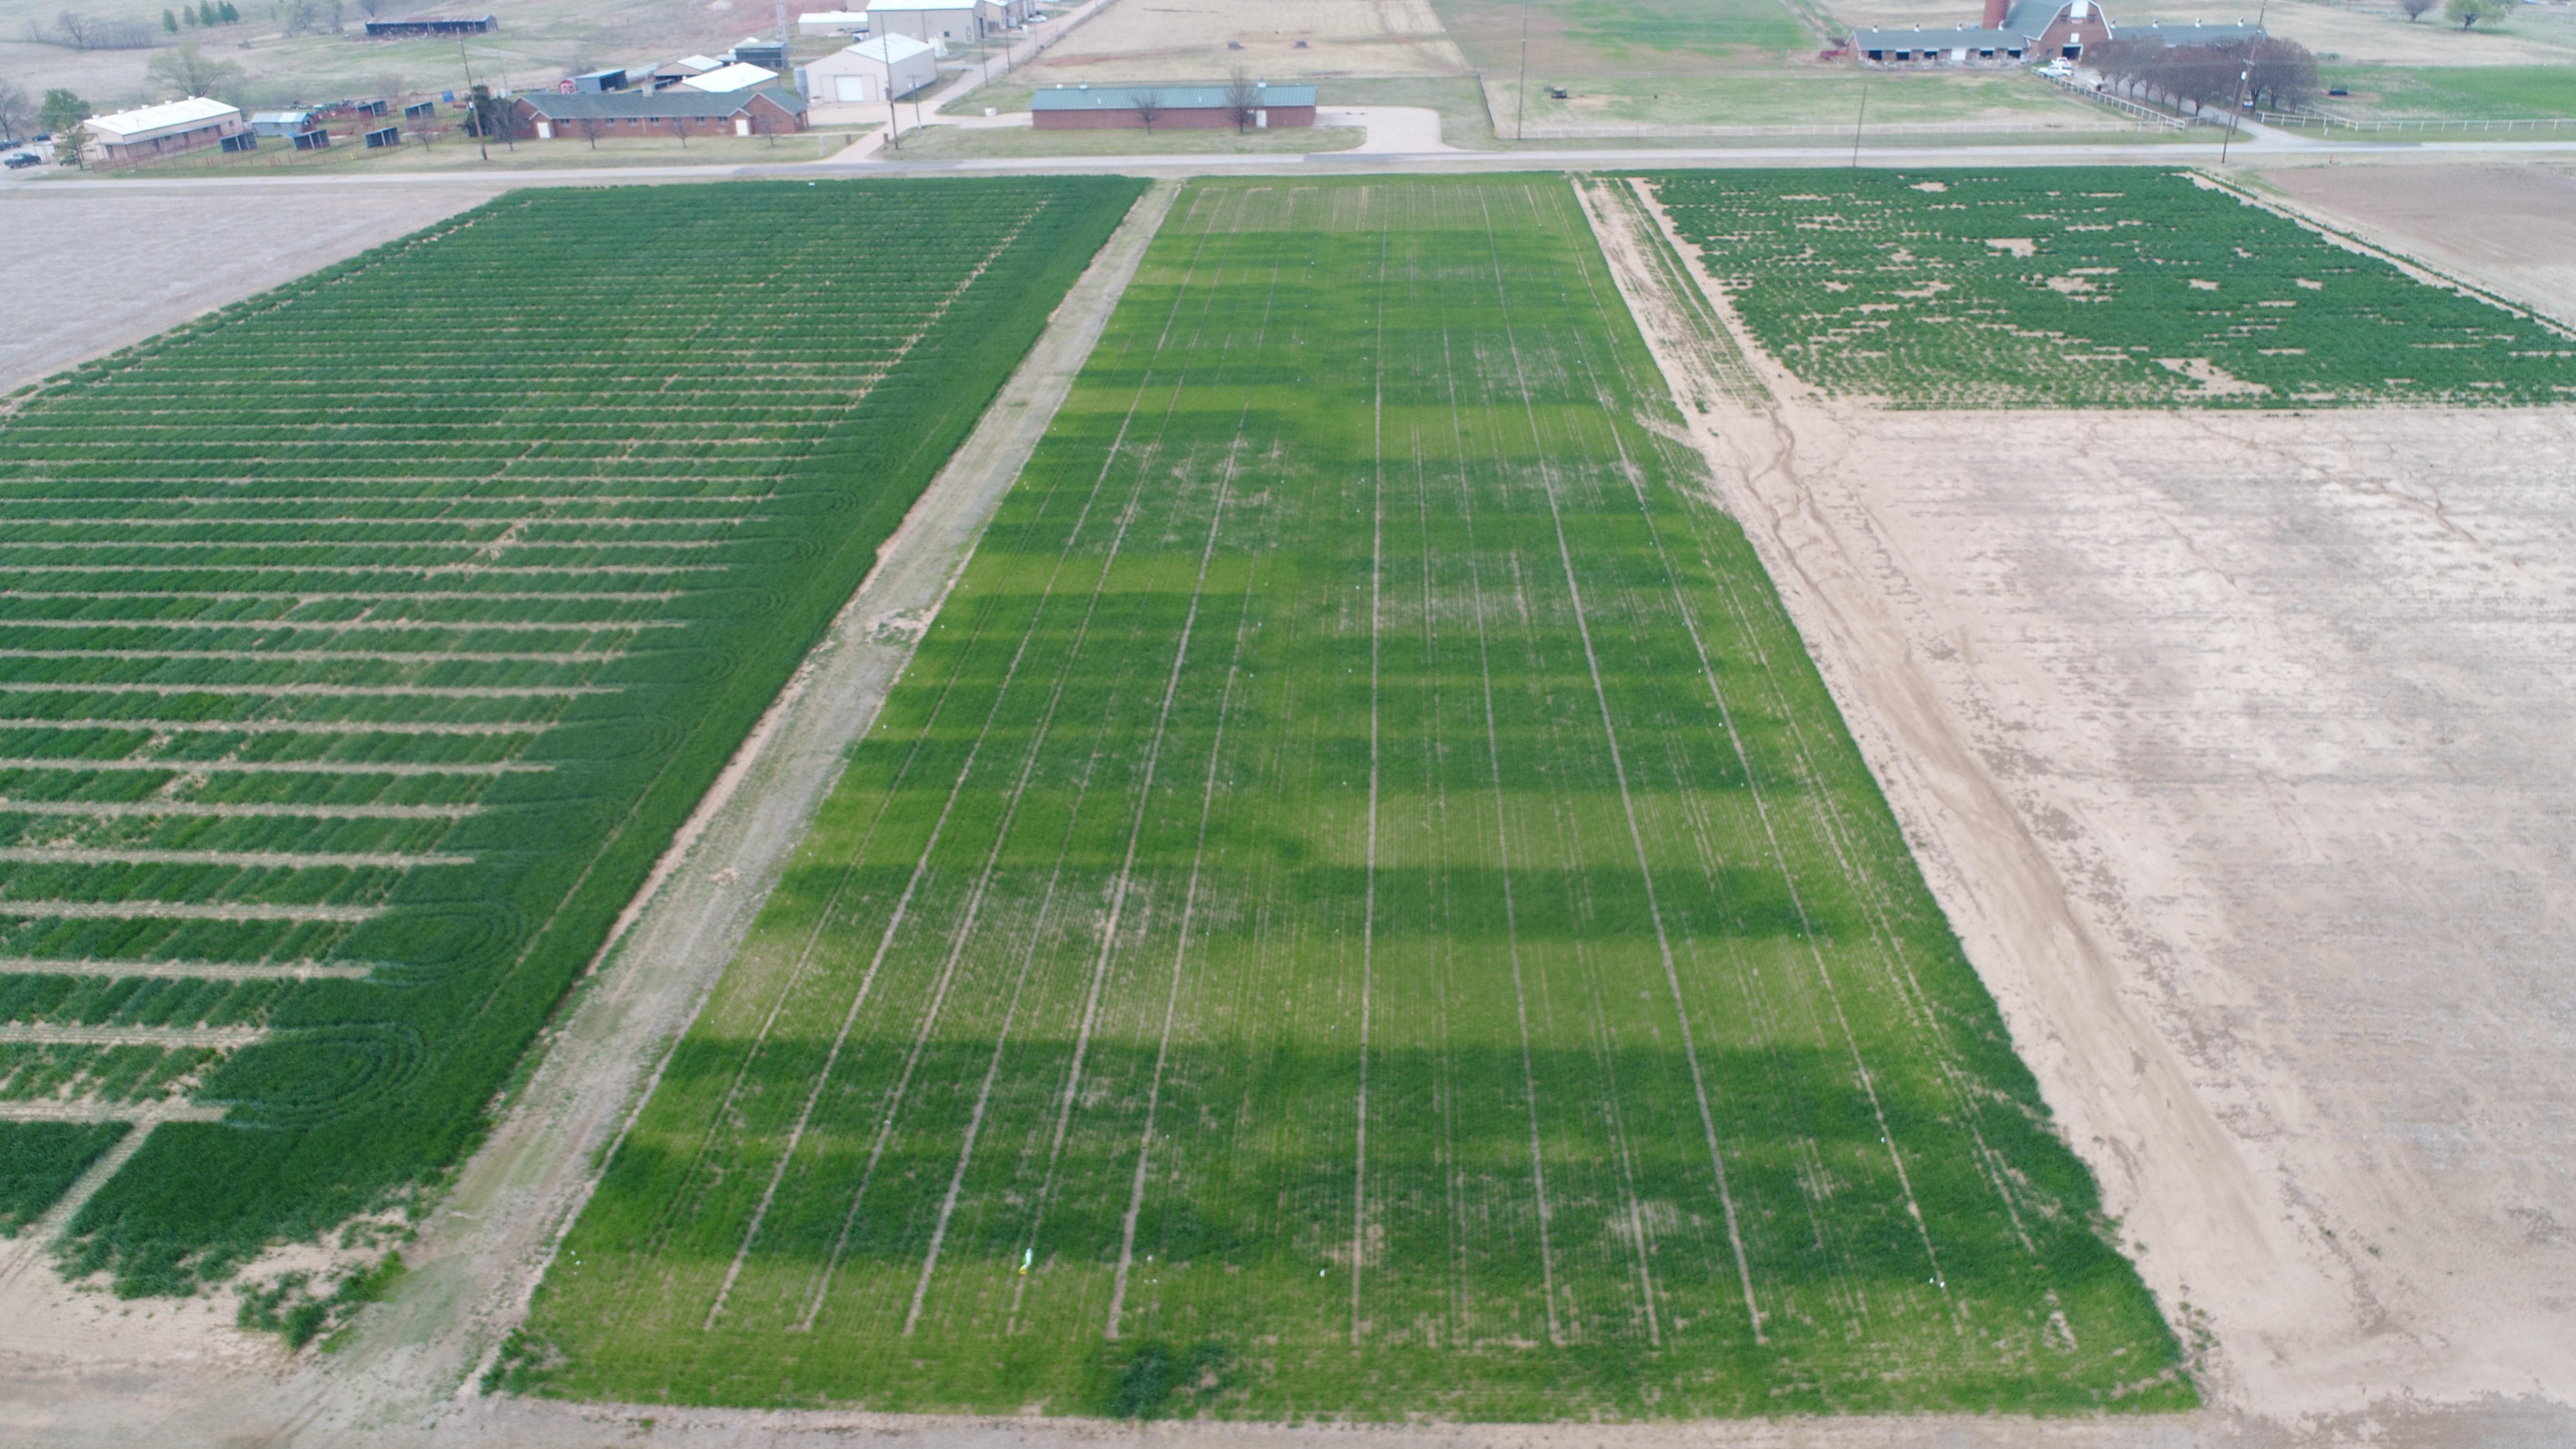
 222, Stillwater, OK
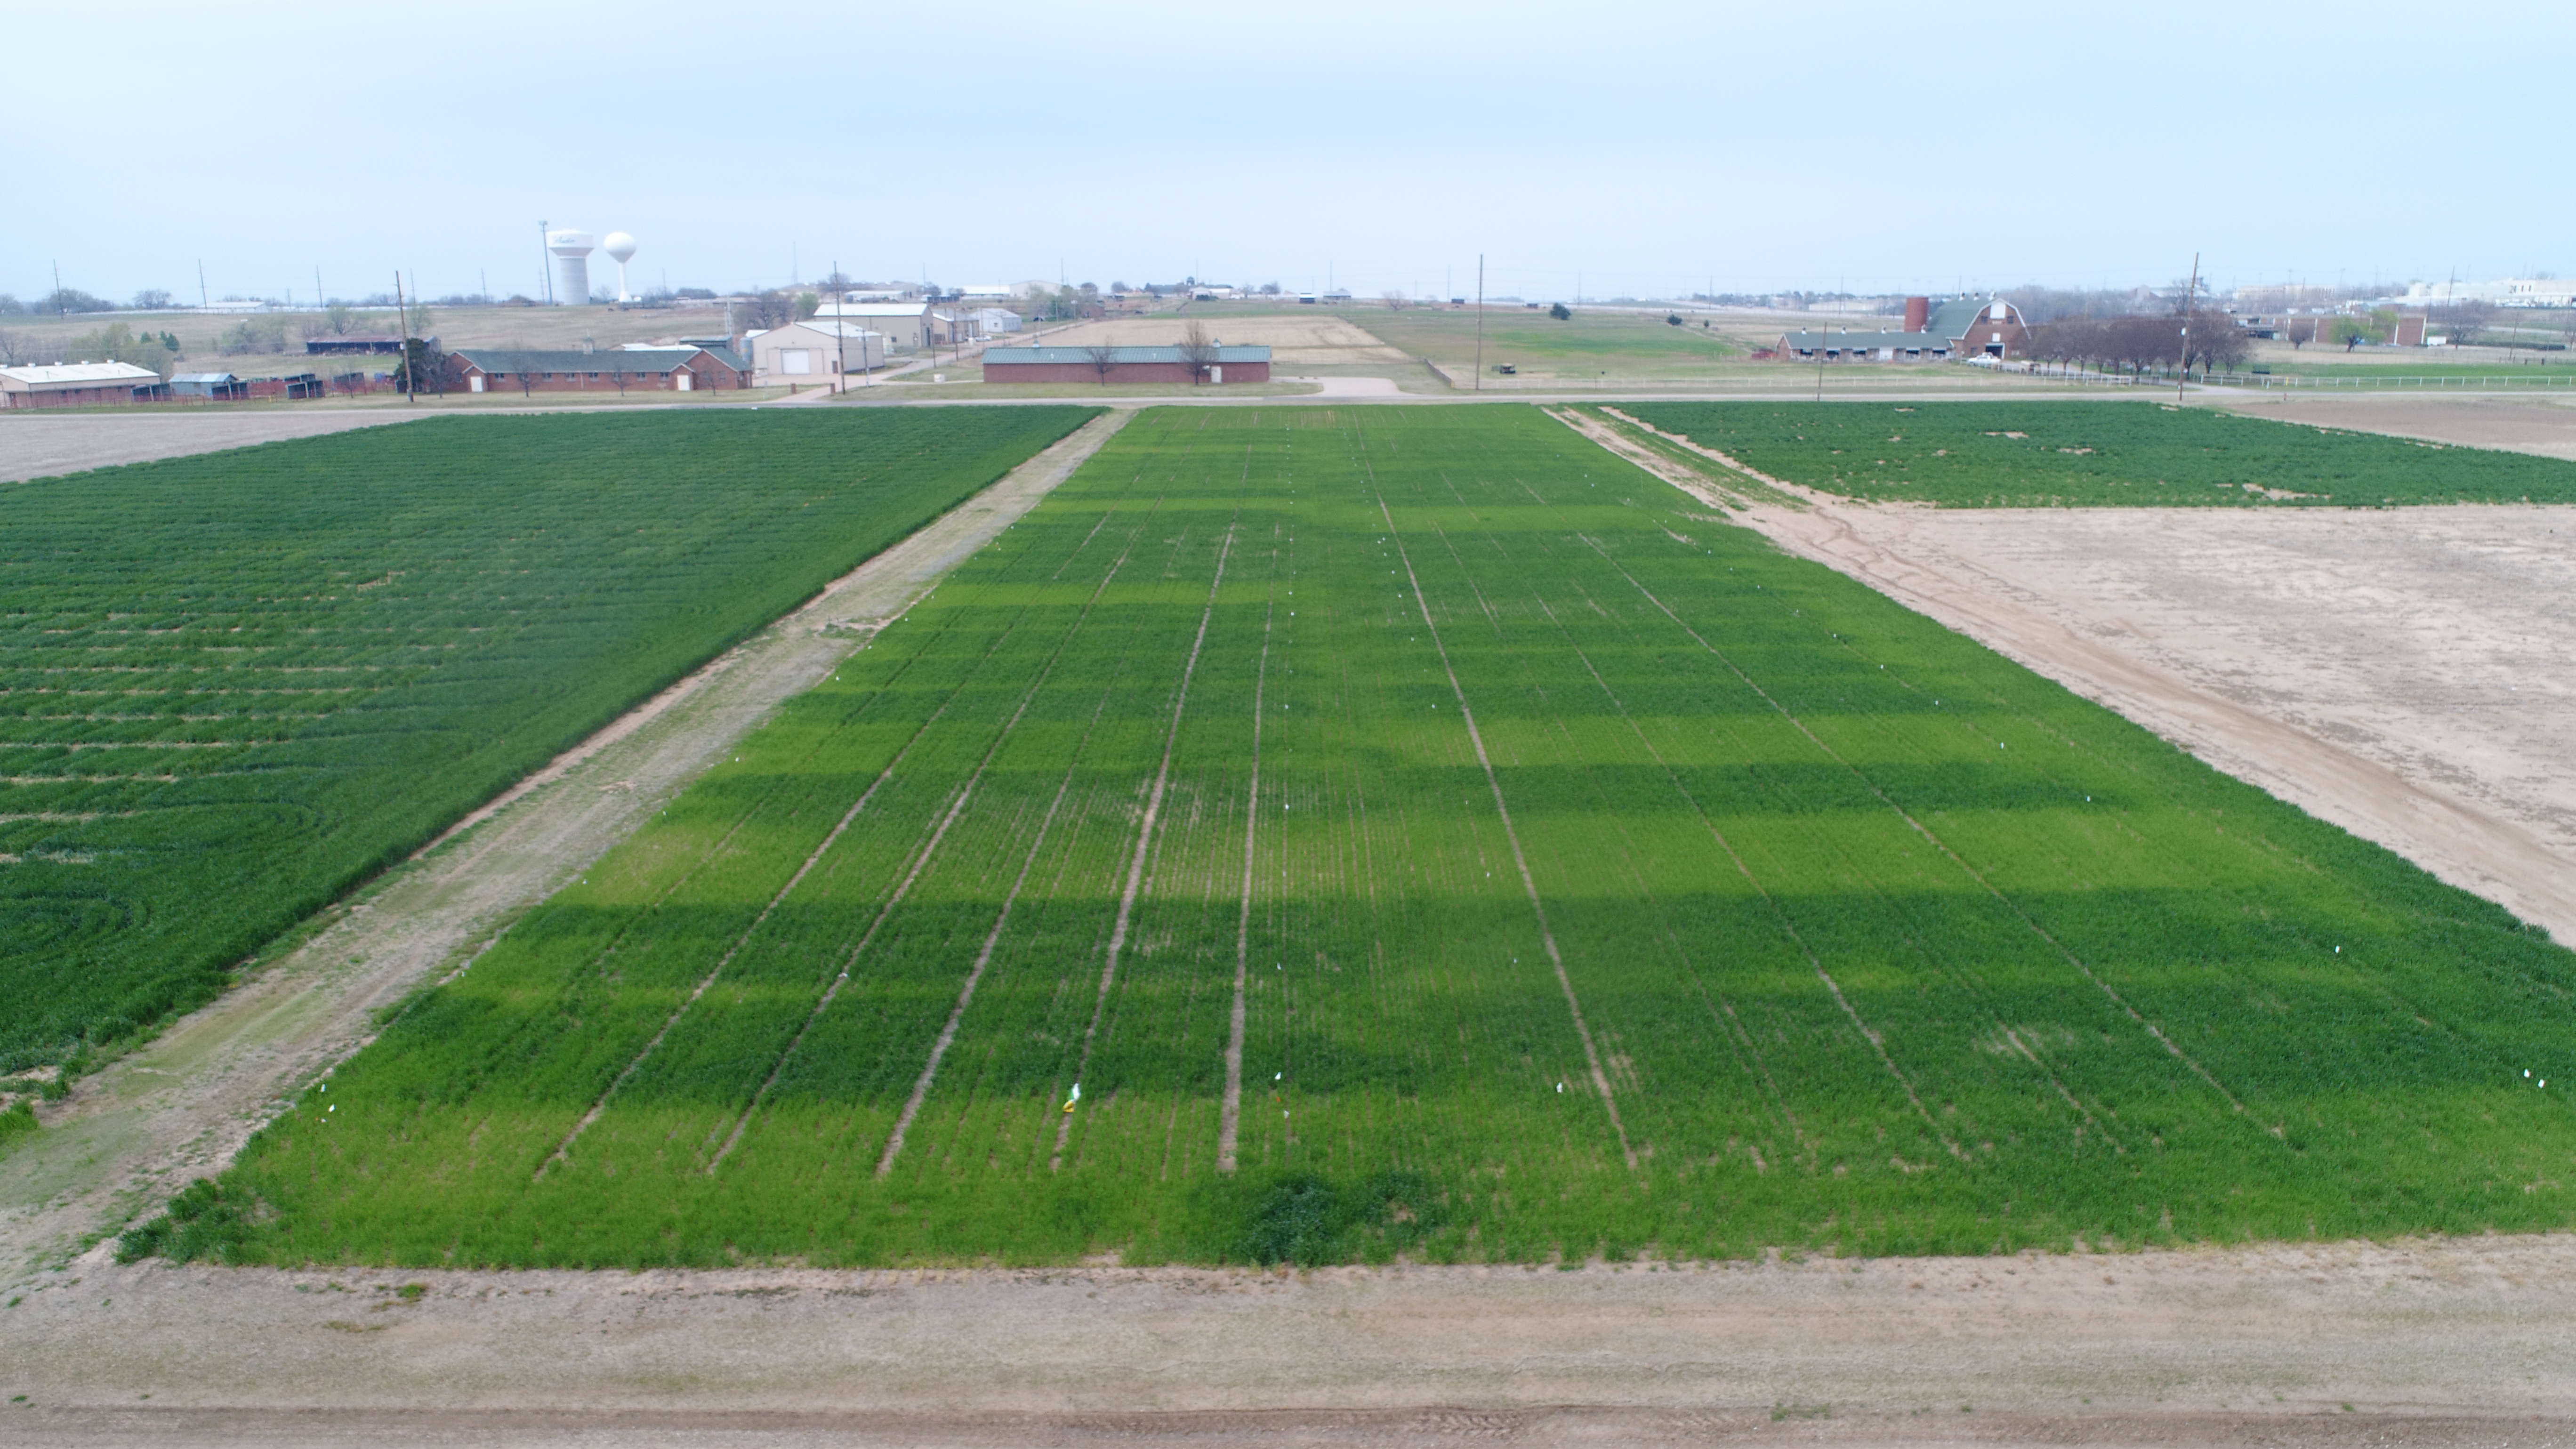