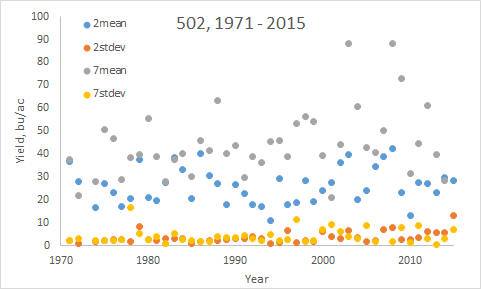
Experiment 502: Wheat Grain Yield Response to Nitrogen, Phosphorus and Potassium Fertilization, Lahoma, OK
PS Coordinates: 36.388267, -98.108654
NW Corner Lat 36 23 16.67 N Long 98 6 32.96 W
NE Corner Lat 36 23 16.74 N Long 98 6 29.33 W
SE Corner Lat 36 23 14.48 N Long 98 6 29.34 W
SW Corner Lat 36 23 14.47 N Long 98 6 32.95 W
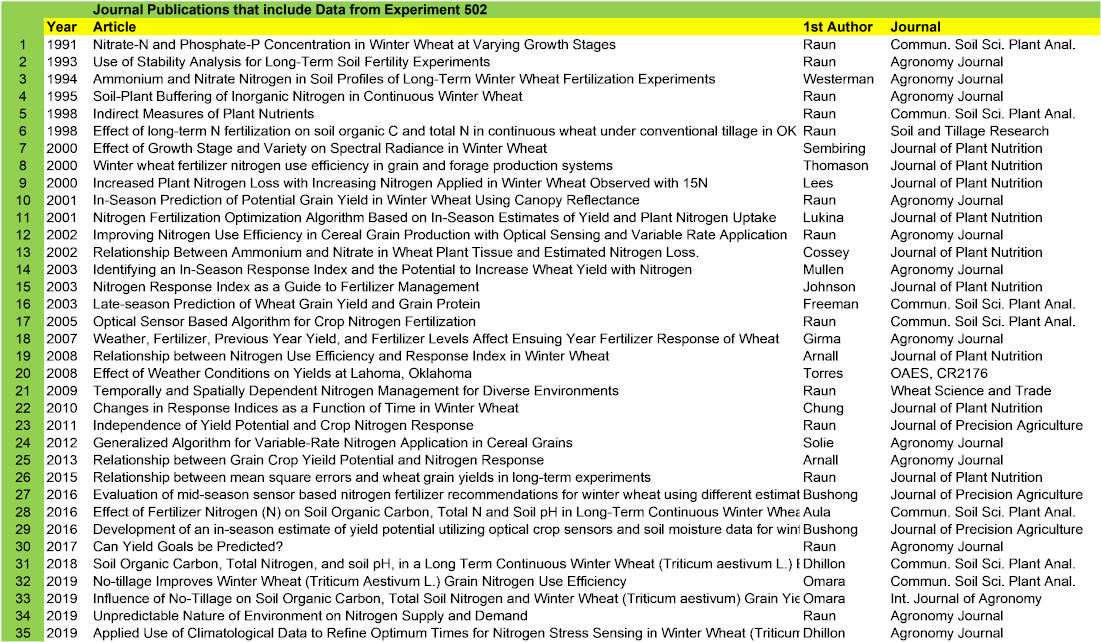
Publications Experiment 502, 1970-present
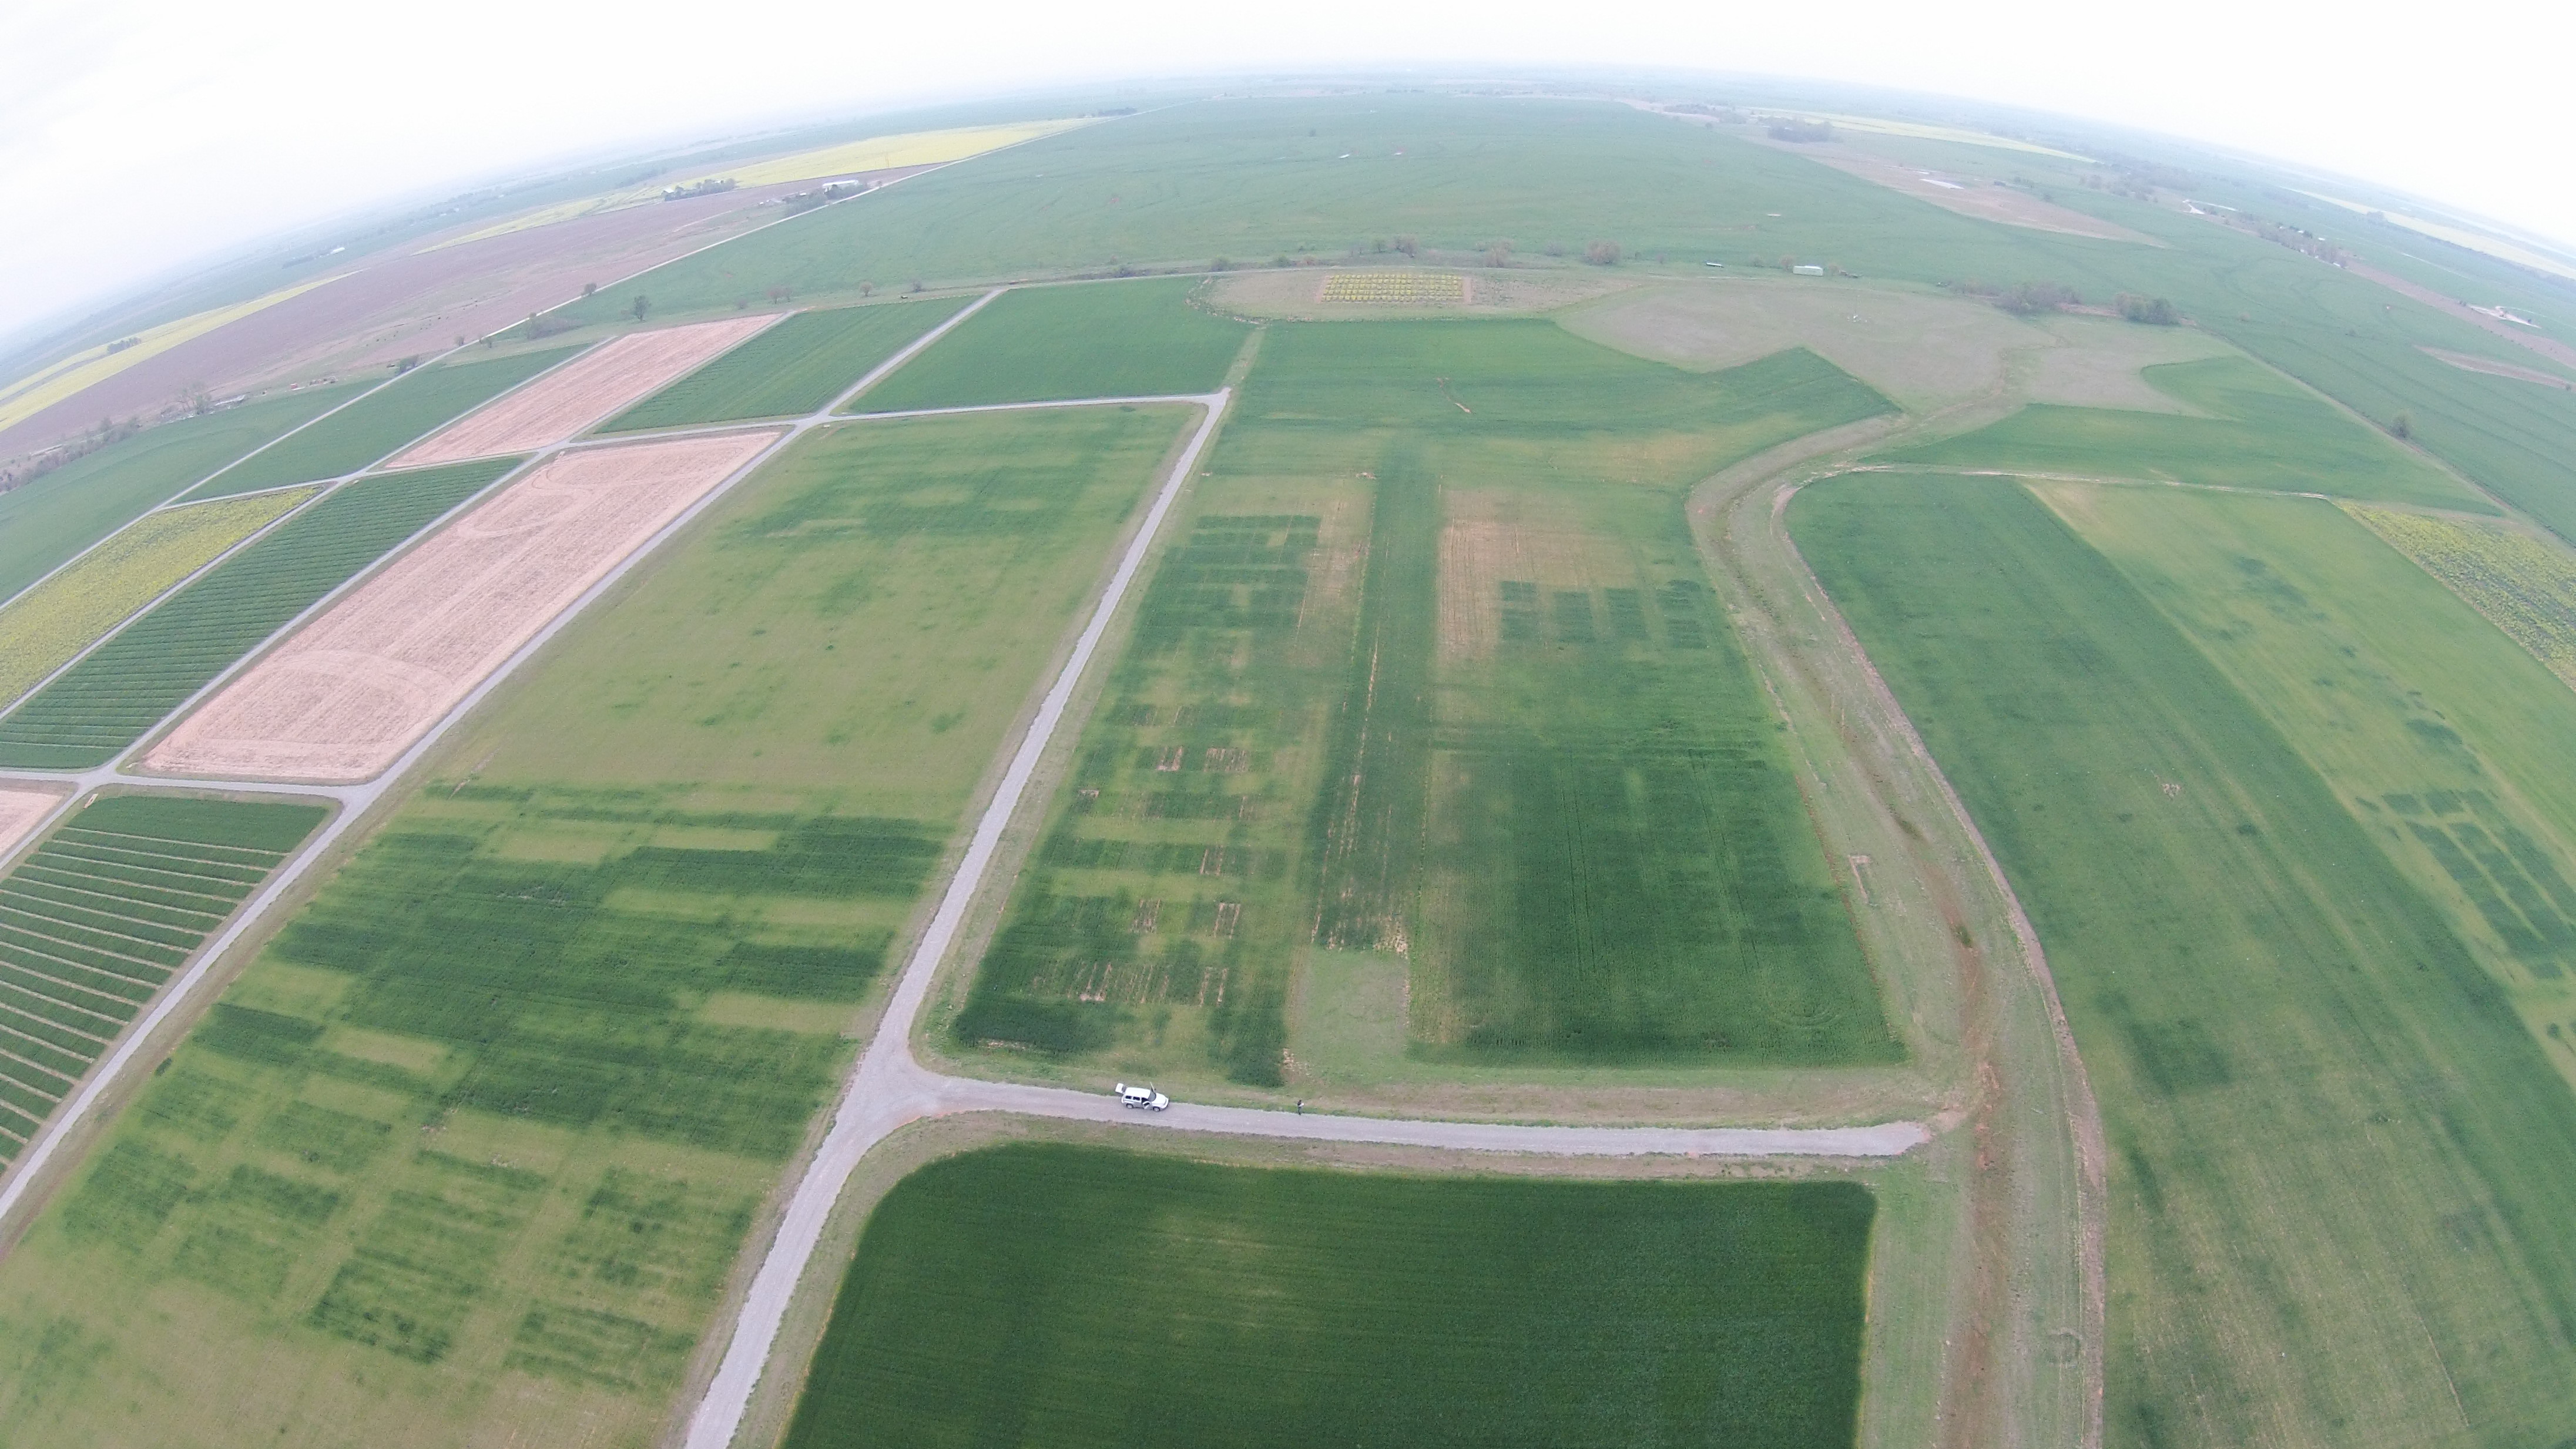
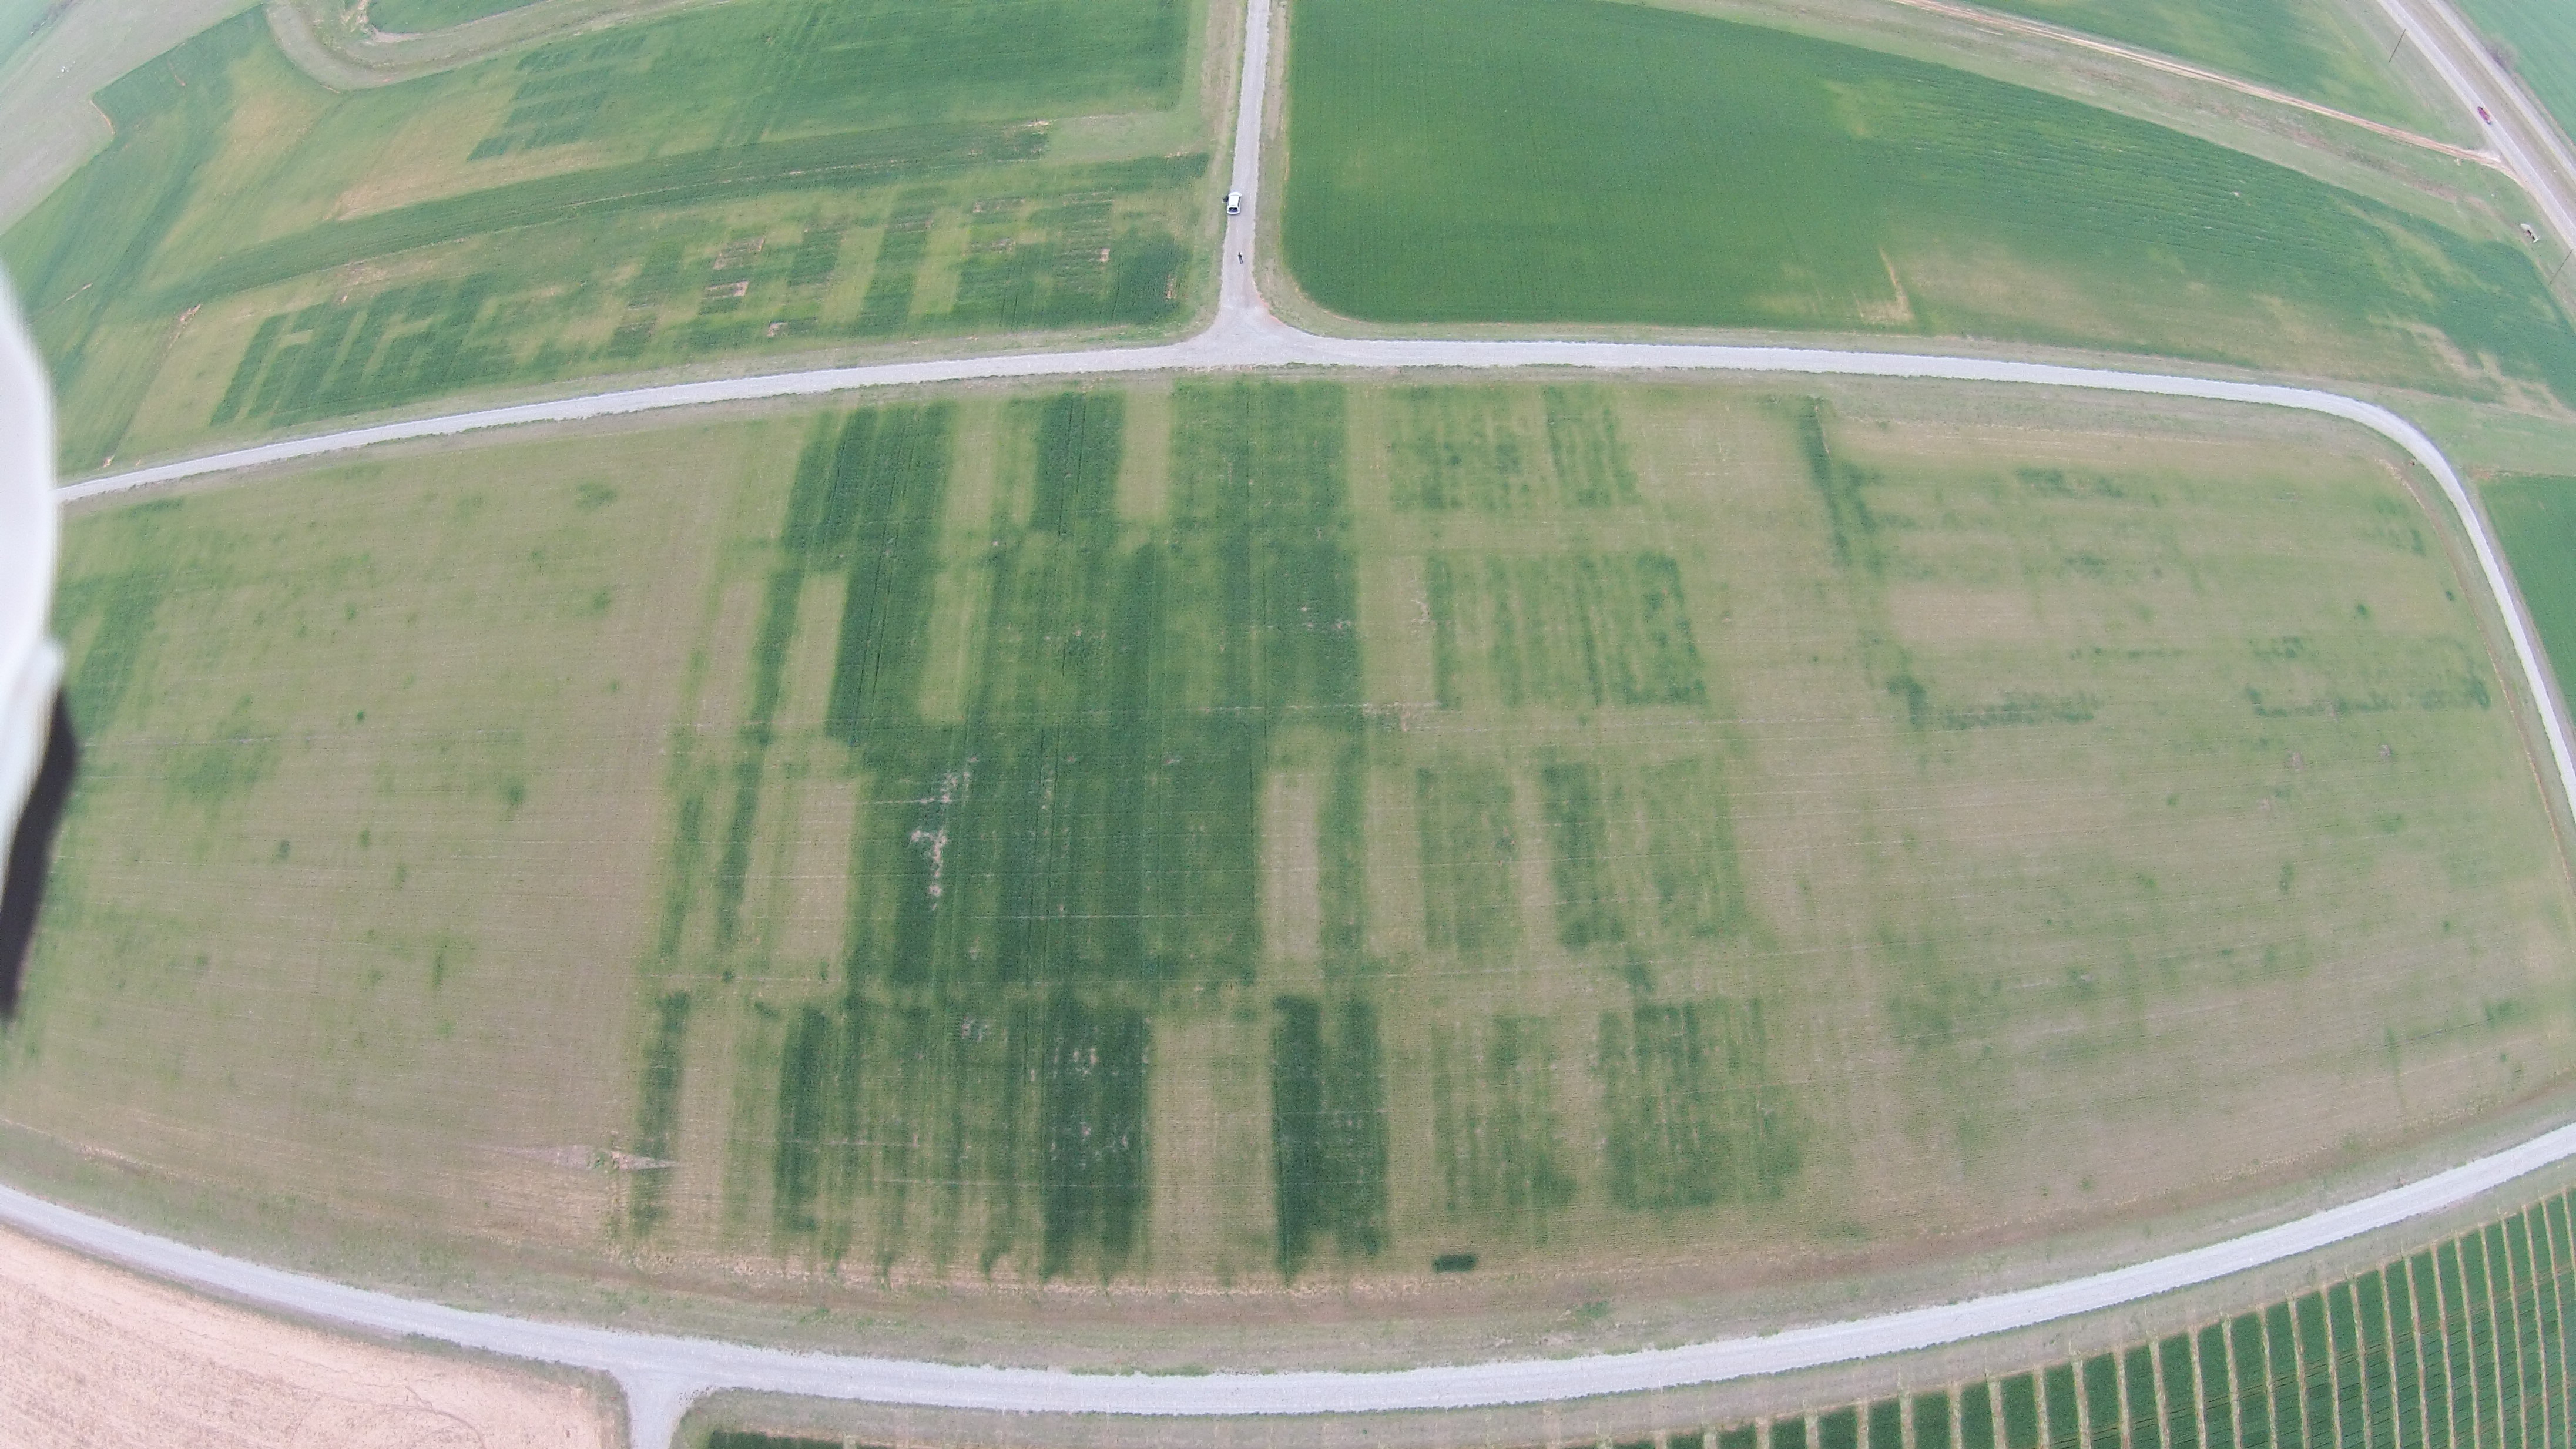
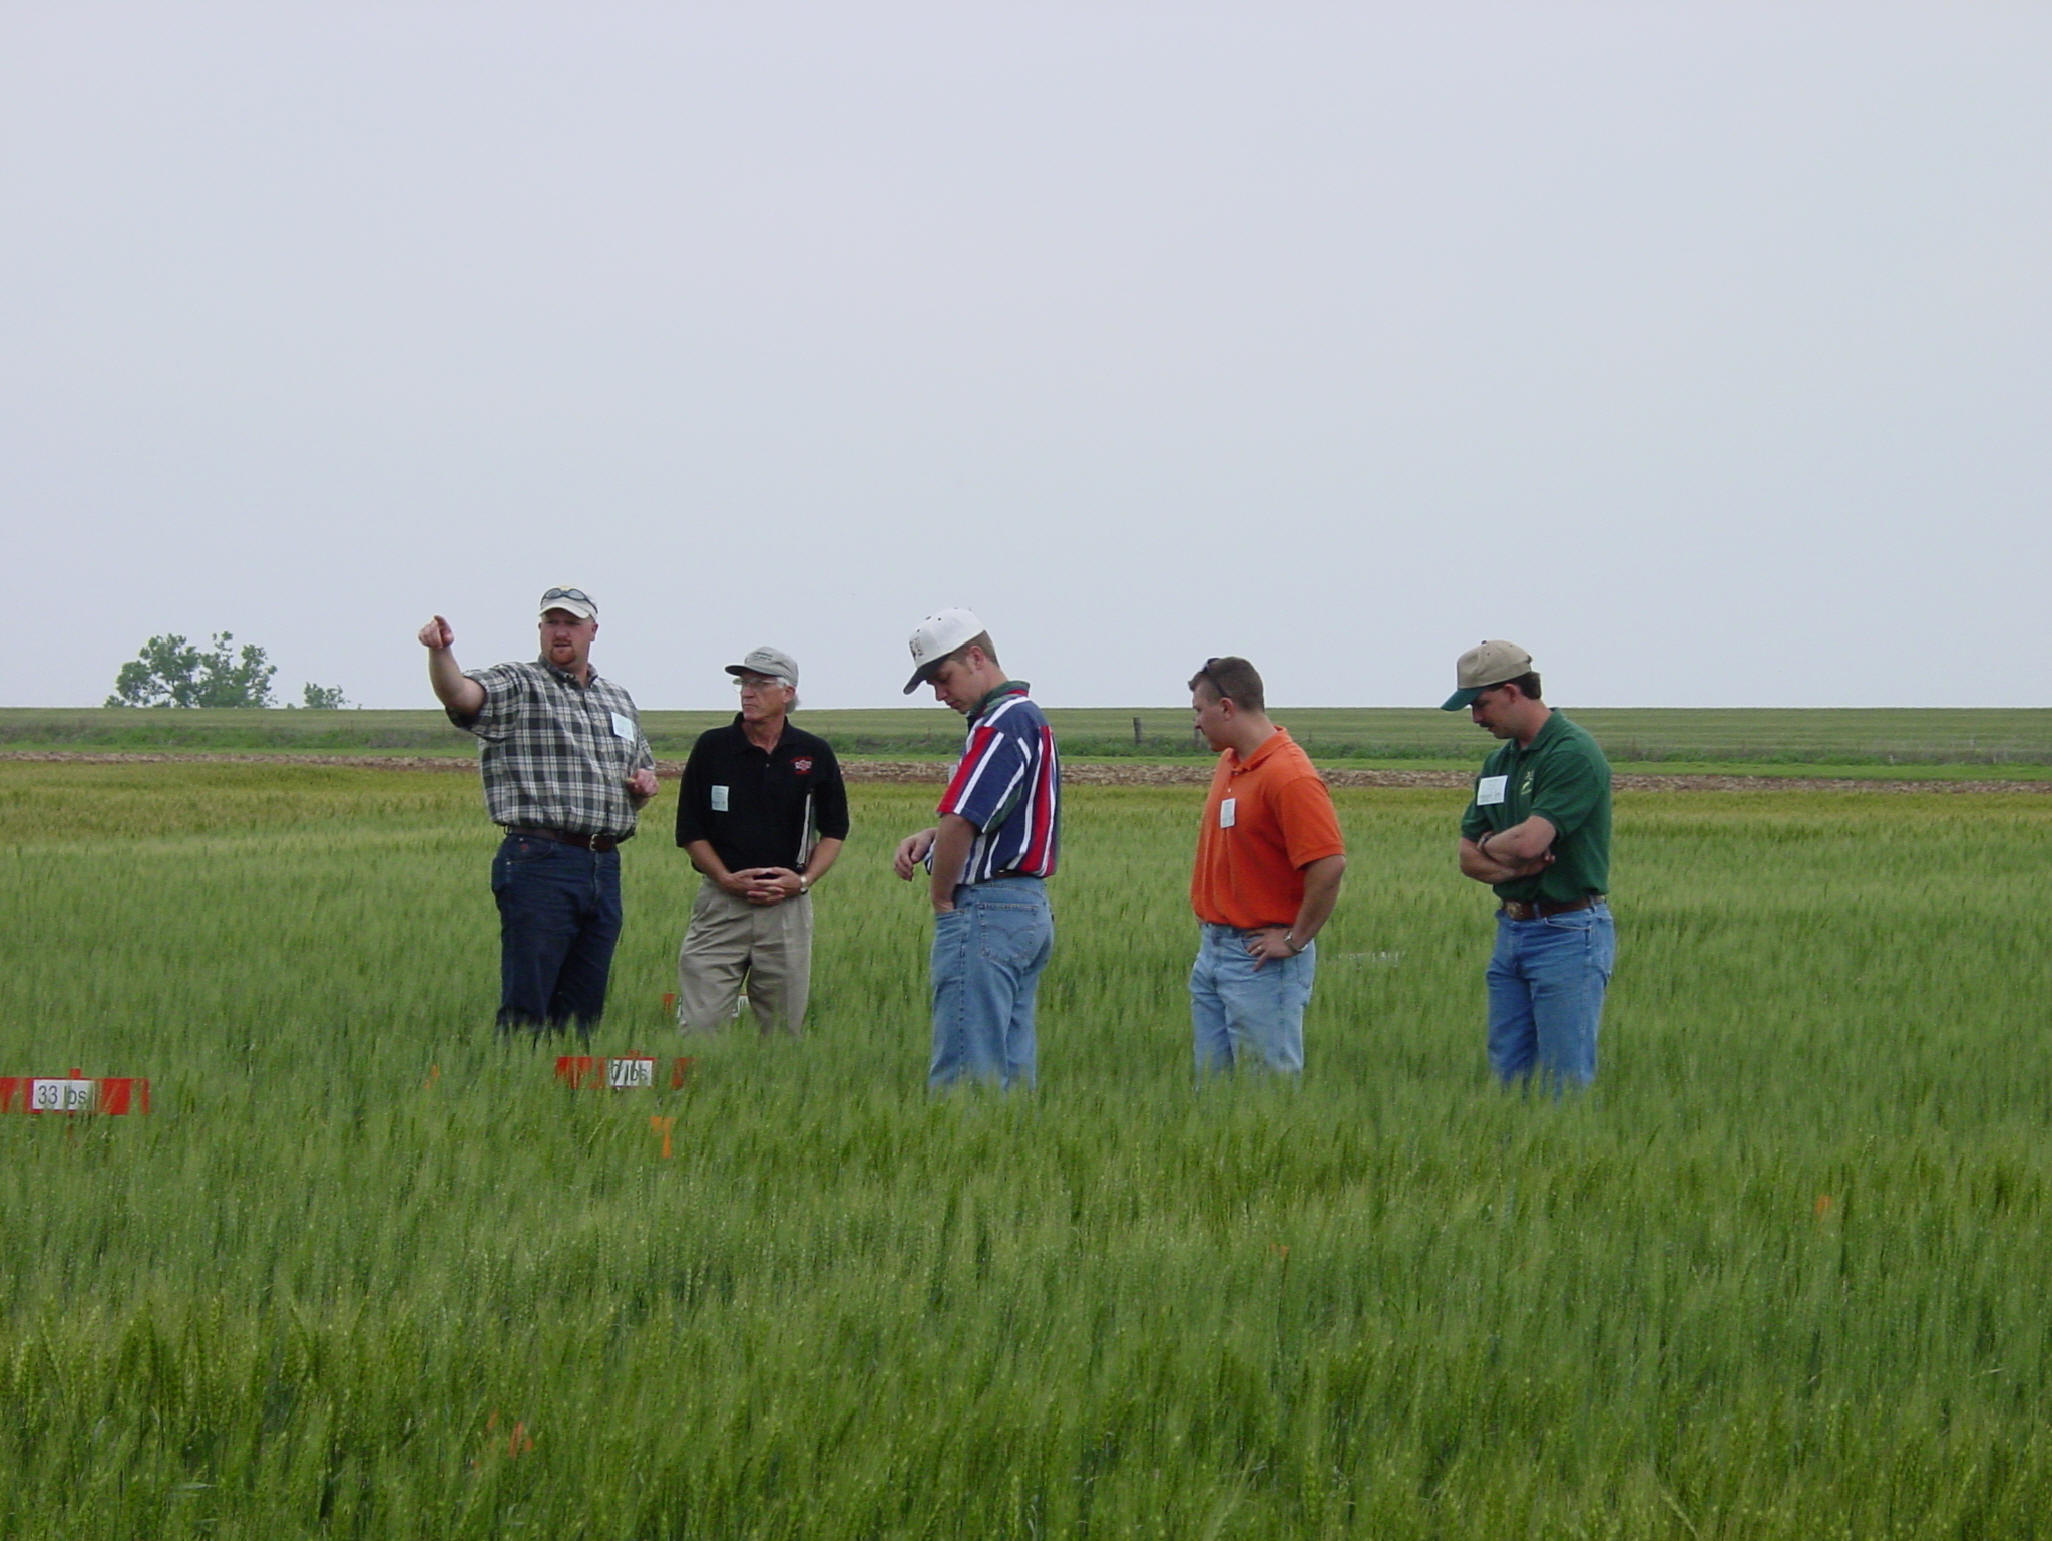
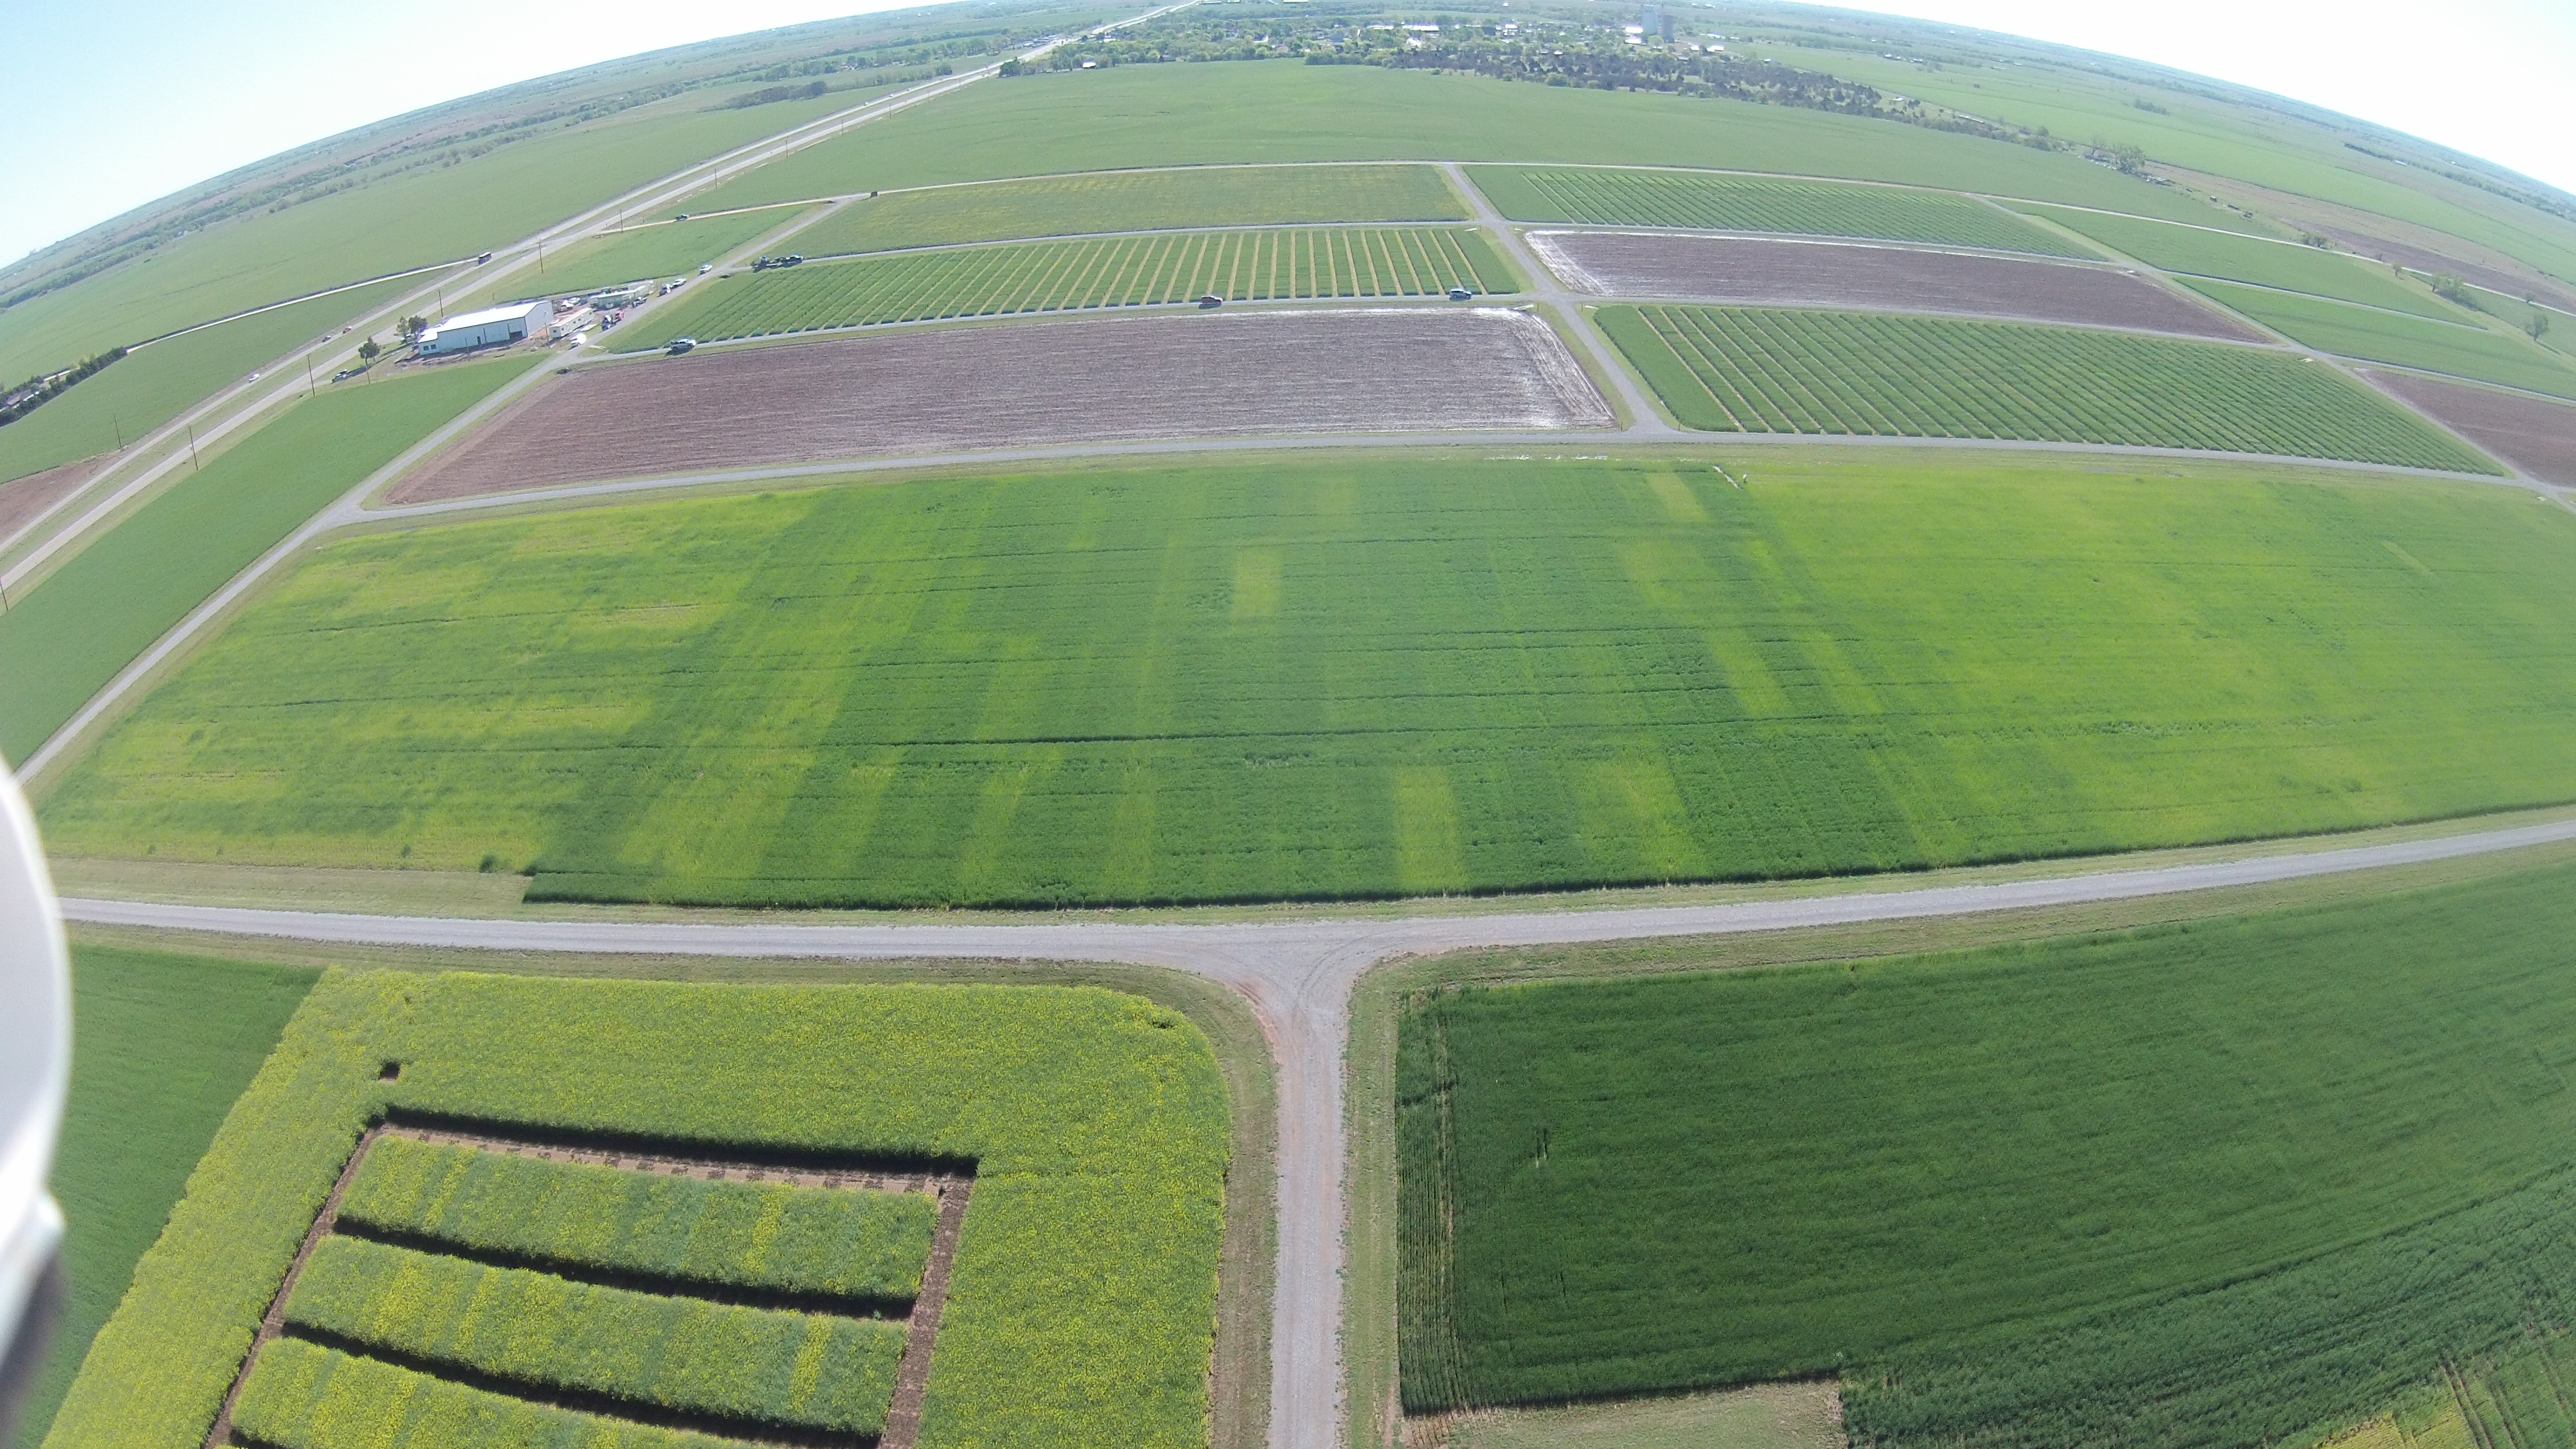 502, looking east
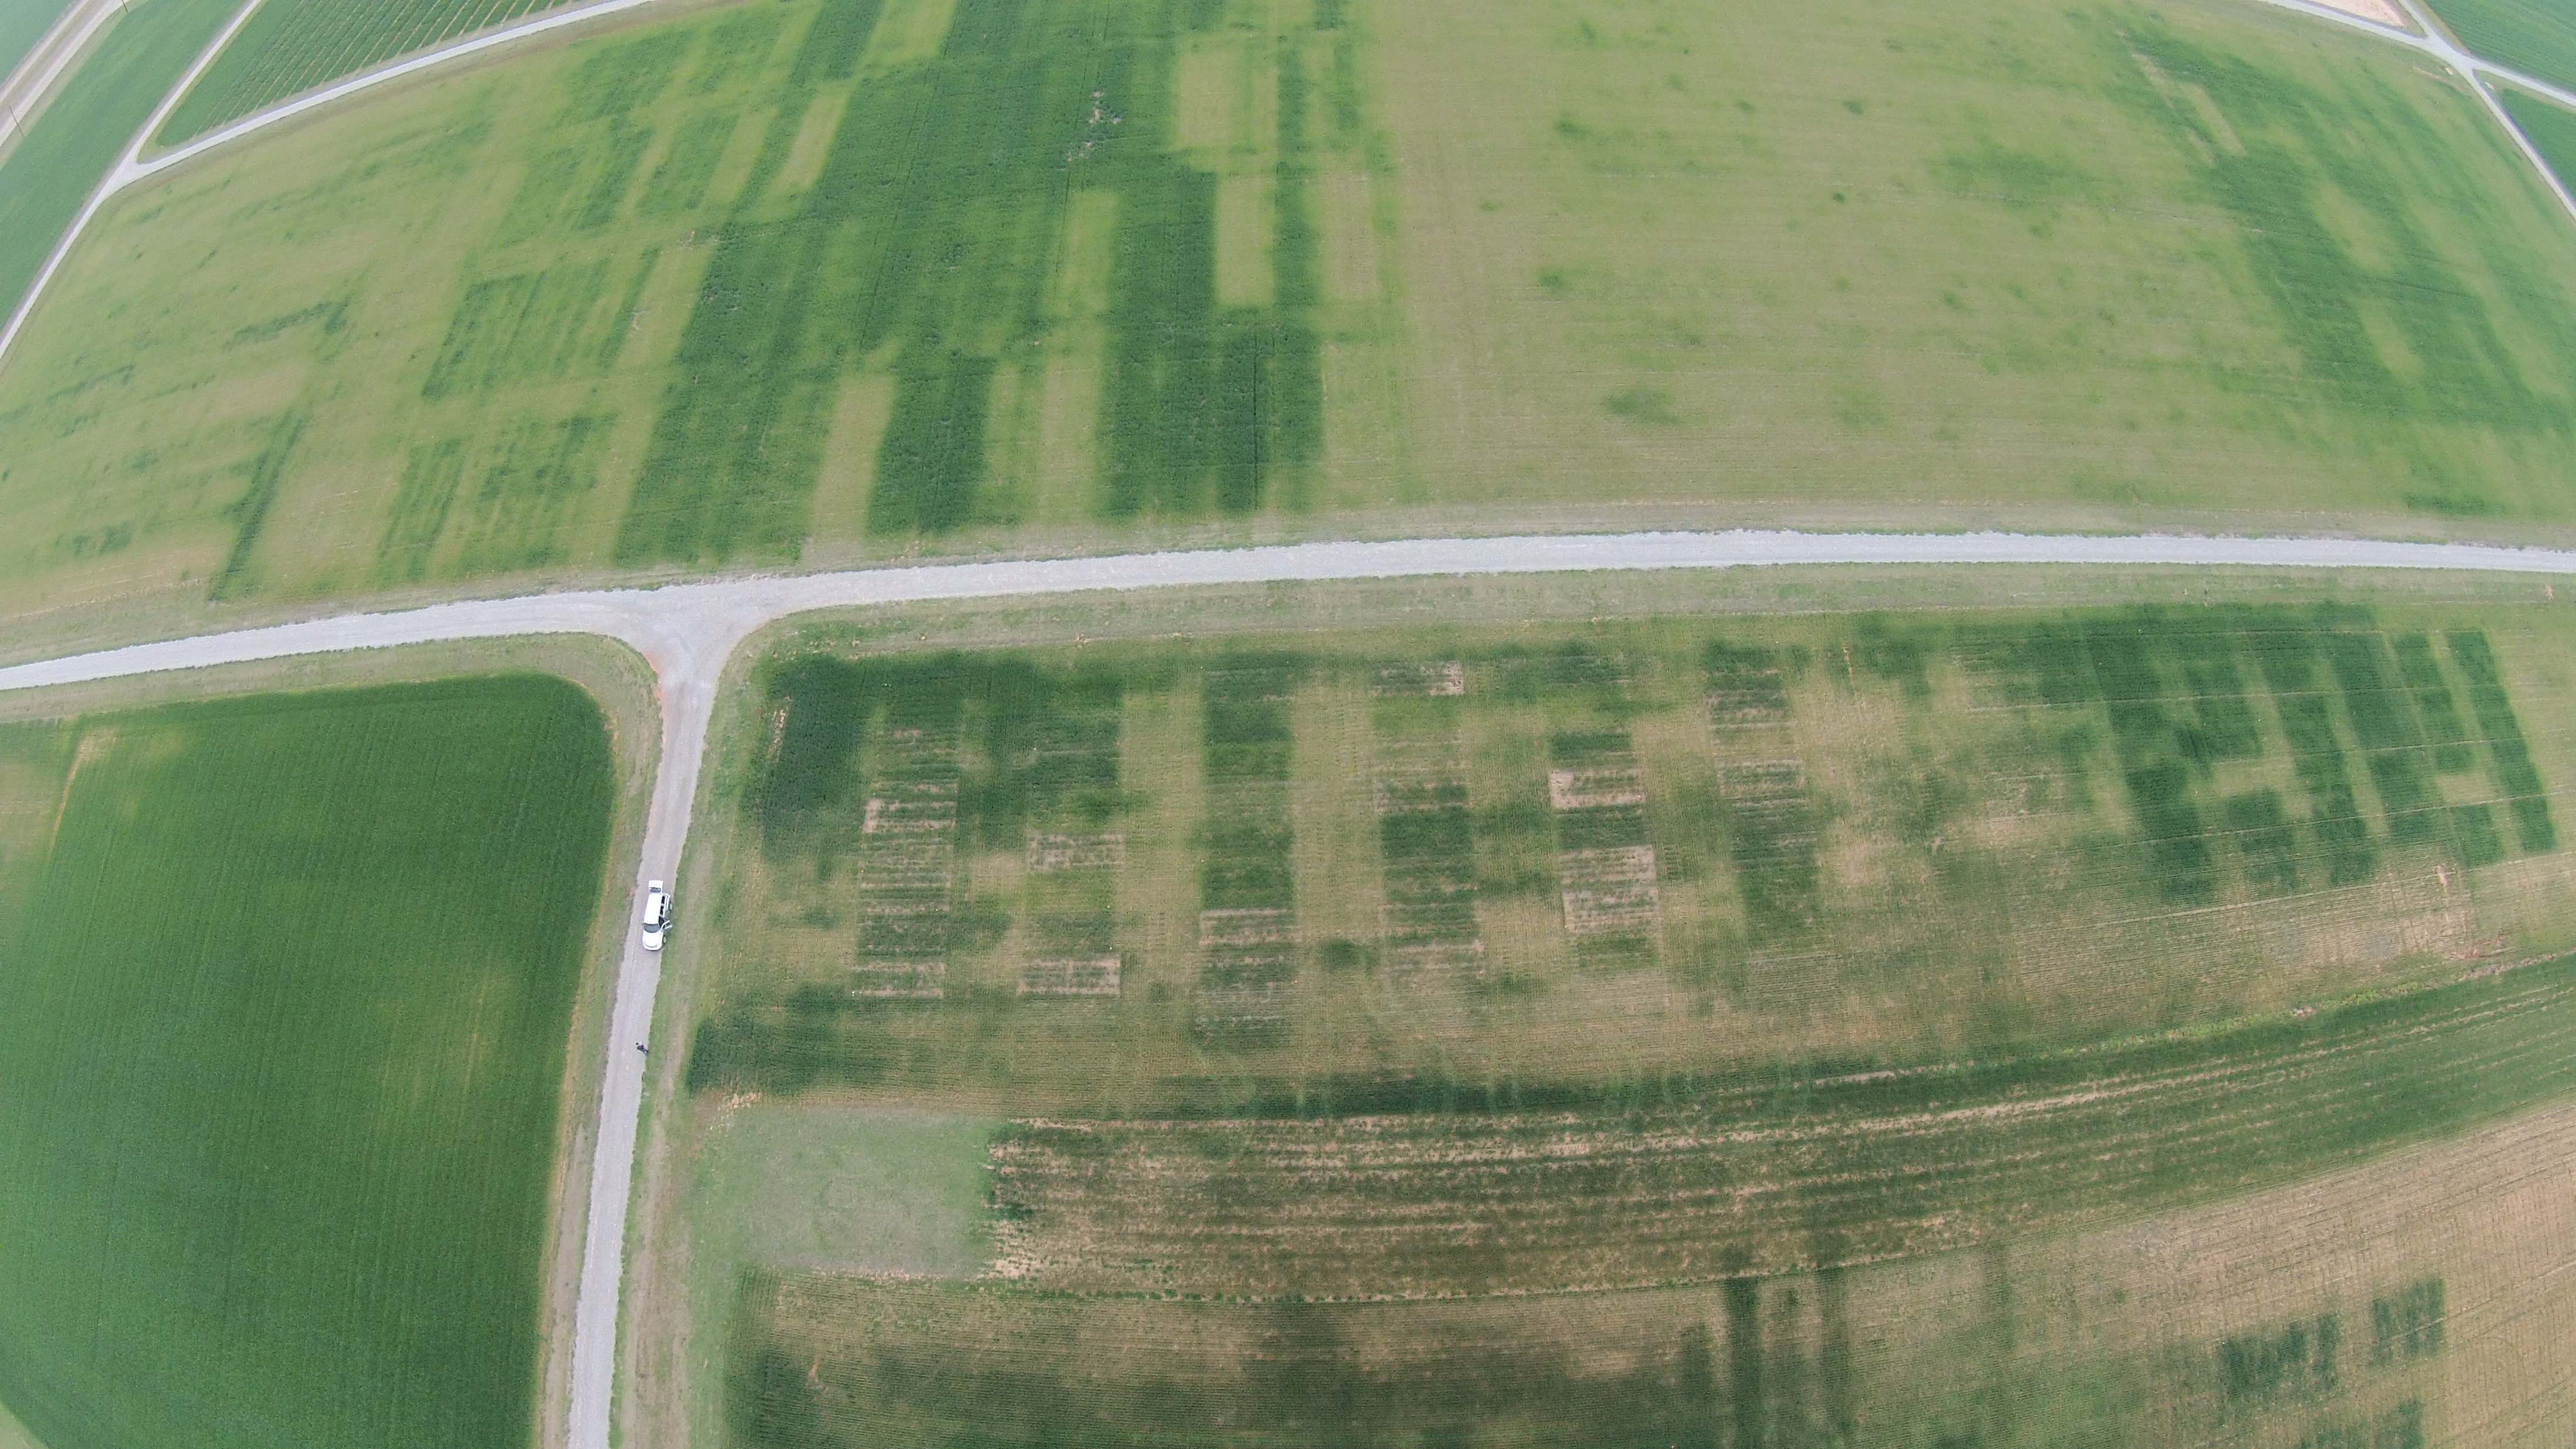
|
Site |
County |
Unit Name |
Soil Classification |
|
Altus |
Jackson |
Hollister silty clay loam |
Fine,smectitic, thermic, Typic Haplustert |
|
Efaw |
Payne |
Norge loam |
Fine-silty, mixed, thermic, Udic
Paleustoll |
|
Grainola |
Fine, mixed, thermic, Vertic Haplustalf |
||
|
Ashport |
Fine-silty, mixed, thermic, Fluventic
Haplustoll |
||
|
Easpur laom |
Fine-loamy, mixed, thermic, Fluventic Haplustoll |
||
|
Lahoma |
Garfield |
Grant silt loam |
Fine-silty,mixed,superactive,thermic, Udic Argiustoll |
|
Pond Creek silt loam |
Fine,silty,mixed, active,thermic, Udic Haplustoll |
||
|
LCB (East) |
Payne |
Port silt loam |
Fine,silty,mixed,thermic,Cumulic Haplustoll |
|
Pulaski fine sandy loam |
Coarse-loamy,mixed,nonacid,thermic, Typic Ustifluvent |
||
|
LCB (West) |
Payne |
Port silt loam |
Fine-silty,mixed,thermic, Cumulic Haplustoll |
|
Oscar |
Fine-silty, mixed, thermic, Typic Natrustalfs |
||
|
Pulaski fine sandy loam |
Coarse-loamy,mixed,nonacid,thermic, Typic Ustifluvent |
||
|
Konawa soils |
Fine-loamy, mixed, thermic, Ultic Haplustalfs |
||
|
Teller soils |
Fine-loamy, mixed, thermic, Udic argiustoll |
||
|
Perkins |
Payne |
Konawa fine sandy loam |
Fine-loamy, mixed, thermic, Ultic Haplustalfs |
|
Teller fine sandy loam |
Fine-loamy, mixed, thermic, Udic argiustoll |
||
|
Stillwater |
Payne |
Norge loam |
Fine-silty, mixed, thermic, Udic
Paleustoll |
|
Kirkland silt loam |
Fine,mixed,thermic,Udertic,Paleustoll |
Abstract
Response of wheat grain
yields to fertilization with nitrogen (N), phosphorus (P) and potassium
(K) has been determined in numerous soil fertility experiments around the
world. Experiment 502 was
established in 1971 to evaluate the effect of long-term N, P and K
fertilization in continuous winter wheat.
Yield increases due to applied N (80 pounds N/acre) have averaged
between 15 and 20 bushels/acre/year.
No response to applied P or K has been seen in any year, since soil
test P and K levels were high when this experiment was initiated in 1970.
Soil test P levels have declined somewhat where no P has been
applied, however, sufficiency levels still exceed 100%.
Soil organic C levels have increased with increasing N applied when
compared to the check. Grain
yields were maximized at the 80 lb N/ac/yr rate.
In the first ten years of the experiment, N applied preplant and
incorporated had no effect on grain %N.
However, in the last 20 years, grain %N increased linearly up to
100 lb N/ac.
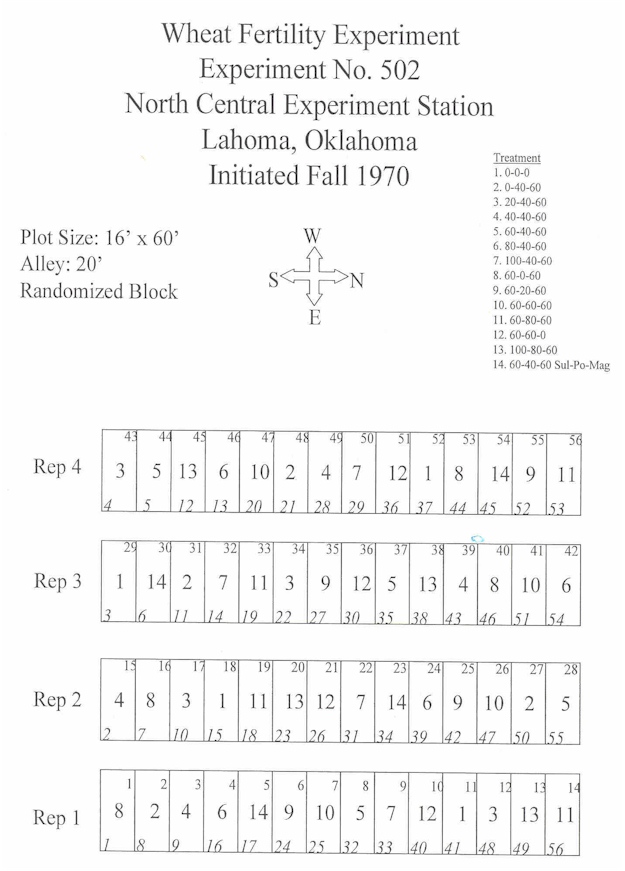
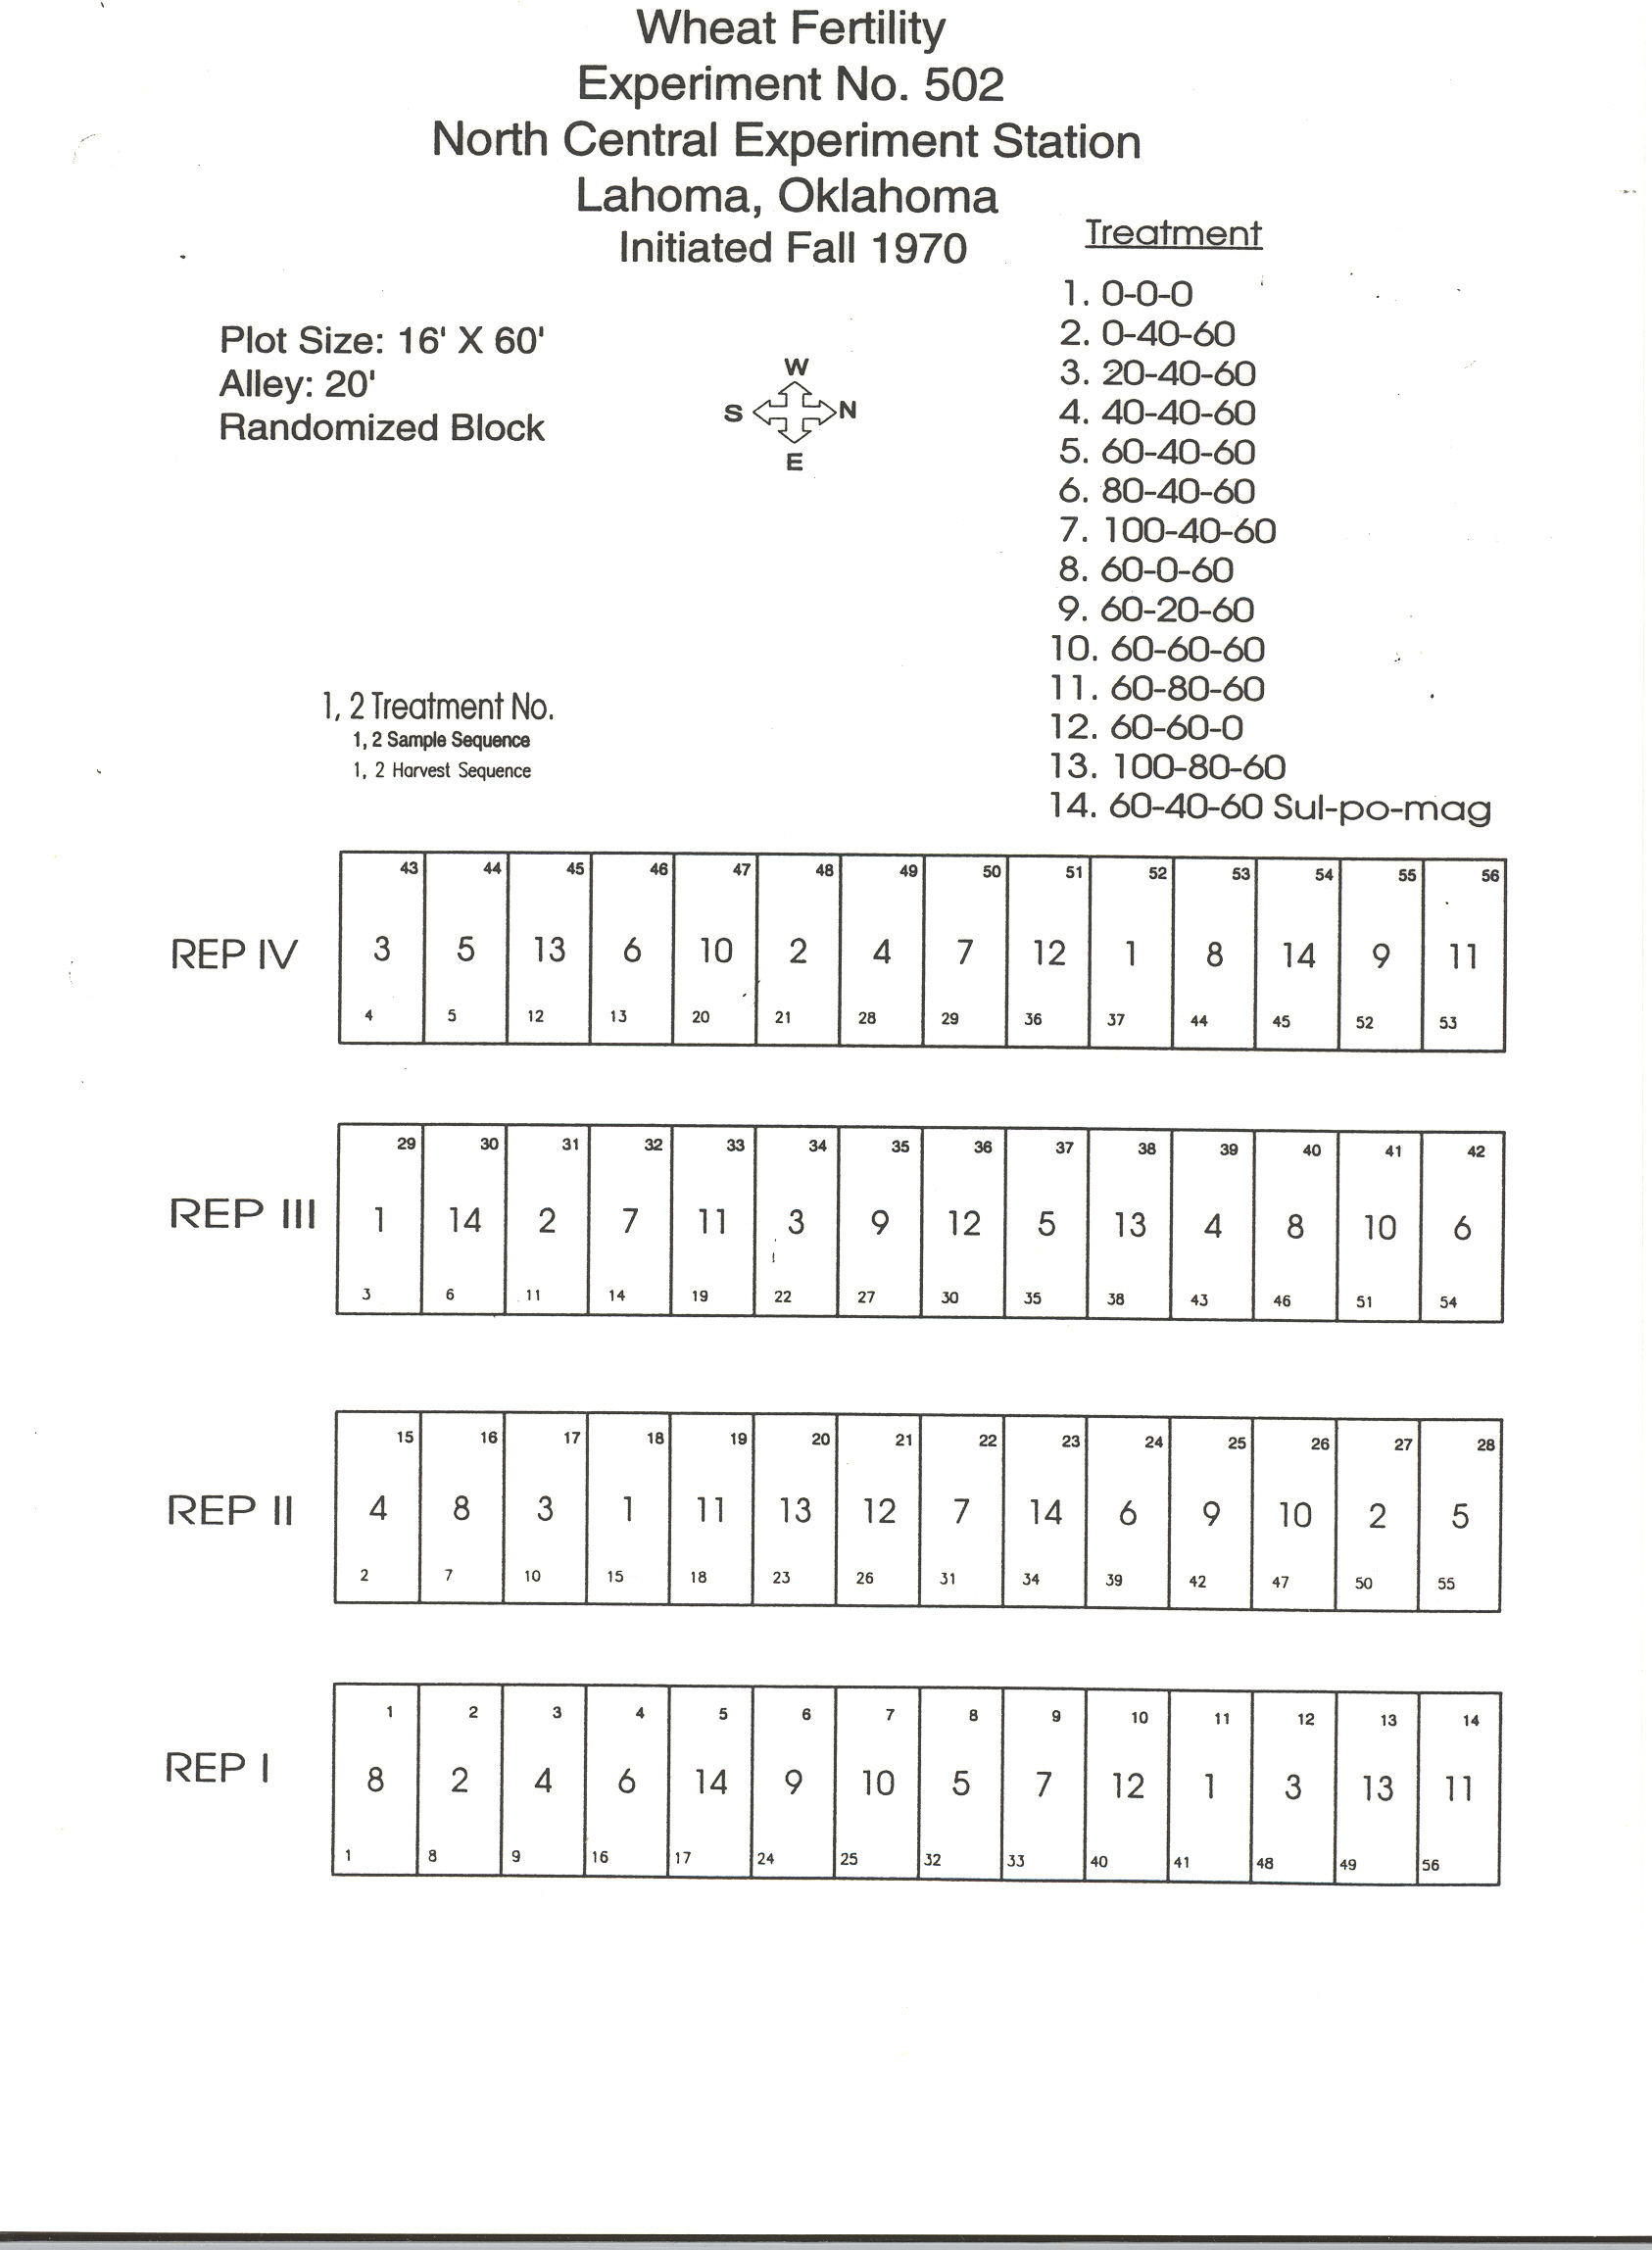
Materials and Methods
Experiment 502 was
established in the fall of 1970 under conventional tillage on a Grant silt
loam (fine-silty, mixed, thermic Udic Argiustoll).
Wheat has been planted for 28 continuous years in 10 inch rows at
seeding rates of 60 pounds per acre.
The variety 'Nicoma' was planted from 1971-74, 'Triumph 64' from
1975-1976, 'Osage' in 1977 and 1979, 'Triumph 64' in 1978, 'TAM W-101'
from 1980-91, Karl 92 from 1993 to 1994 and Tonkawa from 1995 to present.
Changes in management, application dates and fertilization are
reported in Table 1. The
experimental design employed is a randomized complete block with four
replications. Fertilizer treatments used in this experiment and average
grain yield means for selected periods are reported in Table 2.
Results from surface (0-6 inches) soil samples collected in 1995
are reported in Table 3. Individual plots at this site are 16 feet wide and 60 feet
long. The center 10 feet of
each plot was harvested for yield using a conventional combine. In addition to wheat grain yield measured every year
(exception was 1973 where crop failure resulted due to lack of rainfall),
periodic soil and grain samples were taken for further chemical analyses.
Results
In the first ten years of the experiment,
grain yields increased by an average of 14 bushels/acre/year when 80
pounds of N as ammonium nitrate was applied preplant.
Similarly, applied N over the last twenty years of the experiment
resulted in yield increases up to 20 bu/ac.
No increase in grain yield could be attributed to P or K in any
year of the experiment. Soil
test P levels have declined somewhat where no P has been applied, but
sufficiency levels still exceed 100%.
Soil organic C levels increased with increasing applied N when
compared to the check (Table 3). Soil
pH and K have changed very little over the 28 years that these treatments
have been evaluated. In the
first ten years of the experiment N applied preplant and incorporated had
no effect on grain %N. However,
in the last 20 years, grain %N increased linearly up to 100 lb N/ac.
Table
1. Treatment applications and
experimental management for continuous winter wheat Experiment 502, Lahoma,
OK, 1971-2015.
| Year | Variety | Fert App Date | Planting Date | Harvest | Seeding Rate, lb/ac |
| 1971 | Nicoma | ||||
| 1972 | Nicoma | ||||
| 1973 | Nicoma | ||||
| 1974 | NIcoma | ||||
| 1975 | Triumph64 | ||||
| 1976 | Triumph64 | ||||
| 1977 | Osage | ||||
| 1978 | Triumph64 | 6/13/1978 | |||
| 1979 | TAM W-101 | 6/28/1979 | |||
| 1980 | TAM W-101 | 6/24/1980 | |||
| 1981 | TAM W-101 | 10/31/1980 | 6/18/1981 | 65 | |
| 1982 | TAM W-101 | 6/28/1982 | |||
| 1983 | TAM W-101 | 10/18/1992 | 7/1/1983 | ||
| 1984 | TAM W-101 | 6/21/1984 | |||
| 1985 | TAM W-101 | 10/30/1984 | 6/13/1985 | 75 | |
| 1986 | TAM W-101 | 10/21/1985 | 6/11/1986 | 74 | |
| 1987 | TAM W-101 | 10/28/1986 | 6/18/1987 | 68 | |
| 1988 | TAM W-101 | 8/31/1987 | 10/2/1987 | 6/20/1988 | 67 |
| 1989 | TAM W-101 | 10/10/1988 | 10/14/1988 | 6/19/1989 | 70 |
| 1990 | TAM W-101 | 10/13/1989 | 6/20/1990 | 65 | |
| 1991 | TAM W-101 | 8/2/1990 | 10/15/1990 | 6/6/1991 | 65 |
| 1992 | TAM W-101 | 9/9/1991 | 9/26/1991 | 63 | |
| 1993 | Karl | 8/24/1992 | 10/1/1992 | 76 | |
| 1994 | Karl | 9/14/1993 | 9/28/1993 | 75 | |
| 1995 | Tonkawa | 8/5/1994 | 10/28/1994 | 6/19/1995 | 62 |
| 1996 | Tonkawa | 8/31/1995 | 10/10/1995 | 6/21/1996 | 69 |
| 1997 | Tonkawa | 9/4/1996 | 10/3/1996 | 6/13/1997 | 66 |
| 1998 | Tonkawa | 9/11/1997 | 10/17/1997 | 6/12/1998 | 70 |
| 1999 | Tonkawa | 9/3/1998 | 10/9/1998 | 6/30/1999 | 73 |
| 2000 | Custer | 9/8/1999 | 10/12/1999 | 6/13/2000 | 75 |
| 2001 | Custer | 6/15/2001 | |||
| 2002 | Custer | 11/21/2001 | 6/25/2002 | ||
| 2003 | Custer | 10/8/2002 | 6/17/2003 | ||
| 2004 | Custer | 10/15/2003 | 6/11/2004 | ||
| 2005 | Overley | 9/24/2004 | 6/15/2005 | ||
| 2006 | Overley | ||||
| 2007 | Overley | 10/2/2006 | 6/26/2007 | ||
| 2008 | Overley | ||||
| 2009 | Endurance | 9/23/2008 | 9/30/2008 | 6/18/2009 | |
| 2010 | Bullet | 9/15/2009 | 10/7/2009 | 6/11/2010 | |
| 2011 | Bullet | 10/1/2010 | 10/6/2010 | 6/6/2011 | |
| 2012 | Billings | 9/27/2011 | 10/24/2011 | 5/22/2012 | 90 |
| 2013 | Billings | 10/4/2012 | 10/11/2012 | 6/24/2013 | |
| 2014 | Ruby Lee | 10/9/2013 | 10/24/2013 | 6/17/2014 | 70 |
| 2015 | Iba | 10/3/2014 | 10/21/2014 | 6/22/2015 | |
| 2016 | Iba | ||||
| 2017 | |||||
| 2018 | |||||
| 2019 |
Table 2. Treatment structure of long-term wheat Experiment 502, wheat grain yield and percent N in the grain for selected periods, Lahoma, OK, 1971-2000.
|
Trt.
|
N |
P2O5 |
K2O |
1971-1980 |
1981-1990 |
1991-2000 |
1971-2000 |
||||
|
|
|
lb/ac
applied |
|
bu/ac |
%N |
bu/ac |
%N |
bu/ac |
%N |
bu/ac |
%N |
|
1 |
0 |
0 |
0 |
25.6 |
2.07 |
25.8 |
2.06 |
23.5 |
2.26 |
24.9 |
2.10 |
|
2 |
0 |
40 |
60 |
25.3 |
1.88 |
25.9 |
1.97 |
23.1 |
2.29 |
25.3 |
2.10 |
|
3 |
20 |
40 |
60 |
31.0 |
1.94 |
34.4 |
1.94 |
31.6 |
2.23 |
32.8 |
2.08 |
|
4 |
40 |
40 |
60 |
33.4 |
1.88 |
36.0 |
2.17 |
35.8 |
2.37 |
35.9 |
2.21 |
|
5 |
60 |
40 |
60 |
37.4 |
1.99 |
39.7 |
2.33 |
39.7 |
2.45 |
39.6 |
2.33 |
|
6 |
80 |
40 |
60 |
40.1 |
1.88 |
41.2 |
2.47 |
43.0 |
2.53 |
41.9 |
2.41 |
|
7 |
100 |
40 |
60 |
38.5 |
2.04 |
38.4 |
2.62 |
43.6 |
2.73 |
41.3 |
2.58 |
|
8 |
60 |
0 |
60 |
35.0 |
2.11 |
34.5 |
2.55 |
40.5 |
2.60 |
37.6 |
2.46 |
|
9 |
60 |
20 |
60 |
37.0 |
1.98 |
38.6 |
2.38 |
40.7 |
2.50 |
39.3 |
2.31 |
|
10 |
60 |
60 |
60 |
36.9 |
2.05 |
38.8 |
2.31 |
40.5 |
2.43 |
39.9 |
2.28 |
|
11 |
60 |
80 |
60 |
38.6 |
2.03 |
41.2 |
2.29 |
40.4 |
2.47 |
41.0 |
2.27 |
|
12 |
60 |
60 |
0 |
37.2 |
1.84 |
38.6 |
2.35 |
41.7 |
2.48 |
40.3 |
2.27 |
|
13 |
100 |
80 |
60 |
39.2 |
2.18 |
38.4 |
2.43 |
40.3 |
2.76 |
40.0 |
2.45 |
|
14 |
60 |
40 |
60* |
39.3 |
1.98 |
41.3 |
2.40 |
42.3 |
2.43 |
41.1 |
2.31 |
|
SED |
|
|
|
3.1 |
0.17 |
3.1 |
0.12 |
2.7 |
0.09 |
2.9 |
0.13 |
|
CV |
|
|
|
12 |
12 |
12 |
7 |
10 |
6 |
11 |
8 |
N, P2O5,
and K2O applied as
ammonium nitrate (34-0-0), triple superphosphate (0-46-0) and potassium
chloride (0-0-60), respectively. * K2O
applied as sul-po-mag
(0-0-22). SED - standard error of the difference between two equally
replicated means, CV - coefficient of variation.
Table 3.
Treatment structure of long-term wheat Experiment 502, and surface
(0-6 inches) soil test analyses from samples collected in the summer of
1995, Lahoma, OK.
|
Trt. |
N |
P2O5 |
K2O |
pH |
Total N |
Organic C |
P |
K |
|
|
lb/ac applied |
|
% |
% |
ppm |
ppm |
||
|
1 |
0 |
0 |
0 |
5.69 |
0.085 |
0.89 |
45 |
423 |
|
2 |
0 |
40 |
60 |
5.81 |
0.083 |
0.88 |
69 |
481 |
|
3 |
20 |
40 |
60 |
5.69 |
0.083 |
0.91 |
71 |
456 |
|
4 |
40 |
40 |
60 |
5.60 |
0.088 |
0.91 |
69 |
458 |
|
5 |
60 |
40 |
60 |
5.47 |
0.086 |
0.96 |
79 |
478 |
|
6 |
80 |
40 |
60 |
5.38 |
0.088 |
0.92 |
76 |
453 |
|
7 |
100 |
40 |
60 |
5.23 |
0.089 |
0.98 |
83 |
443 |
|
8 |
60 |
0 |
60 |
5.59 |
0.089 |
1.04 |
38 |
487 |
|
9 |
60 |
20 |
60 |
5.65 |
0.090 |
1.09 |
63 |
472 |
|
10 |
60 |
60 |
60 |
5.63 |
0.091 |
1.12 |
96 |
525 |
|
11 |
60 |
80 |
60 |
5.65 |
0.093 |
1.16 |
103 |
472 |
|
12 |
60 |
60 |
0 |
5.52 |
0.090 |
1.12 |
92 |
387 |
|
13 |
100 |
80 |
60 |
5.44 |
0.095 |
1.17 |
129 |
535 |
|
14 |
60 |
40 |
60* |
5.59 |
0.089 |
1.10 |
64 |
460 |
|
|
|
|
|
|
|
|
|
|
|
SED |
|
|
|
0.16 |
0.005 |
0.10 |
14 |
47 |
|
CV, % |
|
|
|
4 |
8 |
14 |
27 |
15 |
N, P2O5,
and K2O applied as
ammonium nitrate (34-0-0), triple superphosphate (0-46-0) and potassium
chloride (0-0-60), respectively. * K2O
applied as sul-po-mag
(0-0-22). SED - standard error of the difference between two equally
replicated means, CV - coefficient of variation.