 Collaborative Research with USDA-ARS,
University of Nebraska
Collaborative Research with USDA-ARS,
University of NebraskaCollaborative Research USDA-ARS, AMES, Iowa
Agronomy Journal 91:357
Yield level and Nitrogen response are Independent (corn and wheat) J. Prec. Agriculture 12:508-518
2005 Evan Brandes Cooperation
Summary 2003: Using the maximum yield Nitrogen Fertilization Optimization Algorithm (NFOA), grain yields were increased by 4 bu/ac when compared to the 80-85 N split (treatment 10 versus 4). For treatment 10 and treatment 4, 80 lb of N /ac was applied at a fixed rate preplant. When topdress N was applied on June 17, 2003, fixed rates were applied in treatments 2, 3, and 4. Treatments 7-11 received topdress N applied using the variable N rate applicator (illustrated below) capable of sensing and treating each corn plant individually. Grain yields were increased by 4 bu/ac for treatment 10 when compared to treatment 4, using 42 less lb N/ac. As a result, the nitrogen use efficiencies of this treatment were 10% better than the split N treatment (treatment 10 vs 4, 40% NUE, and 30% NUE, respectively).
| Corn OFIT Trial, MSEA site, USDA-ARS | Planted: | |||||
| 2003 | Harvest: | |||||
| Treatment | Preplant Rate | Sidedress Rate | N Rate | Total N Rate | Grain Yield | NUE |
| 10 to 12 leaf stage | Pre+topdress | |||||
| lb N/ac | lb N/ac | lb N/ac | lb N/ac | bu/ac | % | |
| 1 | 0 | 0 | 0 | 0 | 118 | |
| 2 | 0 | 89 | 89 | 89 | 165 | 37 |
| 3 | 0 | 161 | 161 | 161 | 170 | 23 |
| 4 | 80 | 85 | 165 | 165 | 193 | 30 |
| 5 | 80 | 0 | 80 | 80 | 180 | 53 |
| 6 | 160 | 0 | 160 | 160 | 181 | 27 |
| 7 | 0 | RI-NFOA | 0+37 | 37 | 141 | 41 |
| 8 | 80 | RI-NFOA 60 % NUE | 80+25 | 105 | 177 | 41 |
| 9 | 0 | MY-NFOA | 0+64 | 69 | 165 | 42 |
| 10 | 80 | MY-NFOA | 80+43 | 123 | 197 | 40 |
| 11 | 80 | RI-NFOA 40% NUE | 80+61 | 141 | 175 | 28 |
| SED | 11 | 13 | ||||
| Replications | 4 | NDVI N Rich | 0.513 | RI = 1.2 | ||
| Soil N applied at the base of each corn plant | NDVI Check | 0.448 | ||||
RI NFOA -nitrogen fertilization optimization
algorithm (based on the response index)
MY MFOA - nitrogen fertilization optimization algorith (based on maximum
yield)
Damaged Plots (Application Error, removed from analysis & entered as
missing data) 101, 102, 103, 104, 105, 308
Harvest: September 24, 2002
| Treatment | Preplant Rate | Sidedress Rate | Total N Rate | Grain Yield | NUE | Std. Dev. |
| 8 to 12 leaf stage | ||||||
| lb N/ac | lb N/ac | lb N/ac | bu/ac | bu/ac | ||
| 1 | 0 | 0 | 0 | 107.9 | 0 | 15 |
| 2 | 0 | 70 | 70 | 118.2 | 10.3 | 21 |
| 3 | 0 | 140 | 140 | 115.1 | 3.6 | 21 |
| 4 | 70 | 70 | 140 | 128.3 | 10.2 | 15 |
| 5 | 70 | 0 | 70 | 124.1 | 16.2 | 14 |
| 6 | 140 | 0 | 140 | 123.8 | 7.95 | 10 |
| 7 | 0 | RI NFOA (23) | 23 | 105.9 | 0 | 22 |
| 8 | 70 | RI NFOA (23) | 93 | 130.6 | 17 | 15 |
| 9 | 0 | flat RI NFOA (22) | 22 | 94.3 | 0 | 33 |
| 10 | 70 | flat RI NFOA (22) | 92 | 129.1 | 16 | 6 |
*one of the check plots was lost due to harvest
error
NFOA - nitrogen fertilization optimization algorithm
(N applied to each plant)
flat NFOA - average N rate determined from
treatments 7 and 8, applied uniformly to treatments 9 and 10.
Treatment 4 topdress applied 2 weeks later.
Replications 4
Days from planting to sensing
Soil N applied at the base of each corn plant, June
11, 2002
4/29/2002
Treatment 4 (sidedress application date delayed)
6/11/2002
Border rows for treatments 7 and 8 received flat
rates (25 kg/ha)
Center 2 rows of treatments 7 and 8 were fertilized by-2-plants
308 940-0202
Paul Gangwish, Shelton, NE April 8, 2005

 Dr.
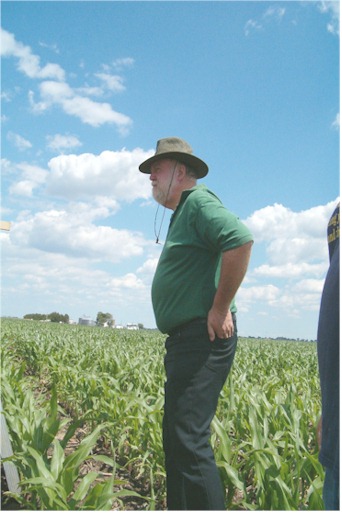
Jim Schepers inspects one of the many variable N rate trials conducted
near Shelton Nebraska at the USDA-ARS MSEA site (June 22, 2004). Dr.
Schepers was the first scientist to establish Nitrogen Reference Strips
for calibrating in-season fertilizer applications.
 David
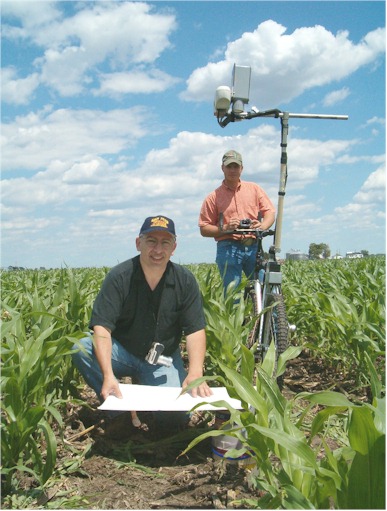
Smith (NTech Industries) and Kent Martin prepare to collect by-plant
sensor readings near Shelton, NE using a GreenSeeker sensor and a shaft
encoding device that writes distance to the same file where NDVI readings
are collected. This allows for accurate determination of average
NDVI on a by-plant basis.
| Corn OFIT Trial, MSEA site, USDA-ARS | |||||
| Planting date: | |||||
| Harvest date: | |||||
| Preplant N Fertilization: | |||||
| Topdress N fertilization: June 11, 2002 | |||||
| Treatment | Preplant Rate | Sidedress Rate | Total N Rate | Grain Yield | Std. Dev. |
| 8 to 12 leaf stage | |||||
| lb N/ac | lb N/ac | lb N/ac | bu/ac | bu/ac | |
| 1 | 0 | 0 | 0 | 107.9* | 15 |
| 2 | 0 | 70 | 70 | 118.2 | 21 |
| 3 | 0 | 140 | 140 | 115.1 | 21 |
| 4 | 70 | 70 | 140 | 128.3 | 15 |
| 5 | 70 | 0 | 70 | 124.1 | 14 |
| 6 | 140 | 0 | 140 | 123.8 | 10 |
| 7 | 0 | NFOA (23) | 23 | 105.9 | 22 |
| 8 | 70 | NFOA (23) | 93 | 130.6 | 15 |
| 9 | 0 | flat NFOA (22) | 22 | 94.3 | 33 |
| 10 | 70 | flat NFOA (22) | 92 | 129.1 | 6 |
| SED = 12.4 | |||||
| *one of the check plots was lost due to harvest error, and this mean is likely overestimated (based on the other 3 values) | |||||
Summary 2002:
1. Applied N increased yields by more than 22 bushels/acre
2. OSU-NU NFOA (trt 8) produced equivalent yields using 47 less lbs N/ac Preplant 70 + Fixed 70 (trt 4)
3. When no N was applied Preplant, by-plant N rates increased yields by 11.6 bu/ac (7 versus 9) compared to flat N rates
4. When 70 lb N was applied preplant, by-plant N rates had equal yields (8 vs 10) compared to flat N rates
5. Nitrogen applied mid-season to plots receiving no preplant N could did not result in equivalent yields when compared to all N applied preplant and/or split applied (early season N stress should be avoided).

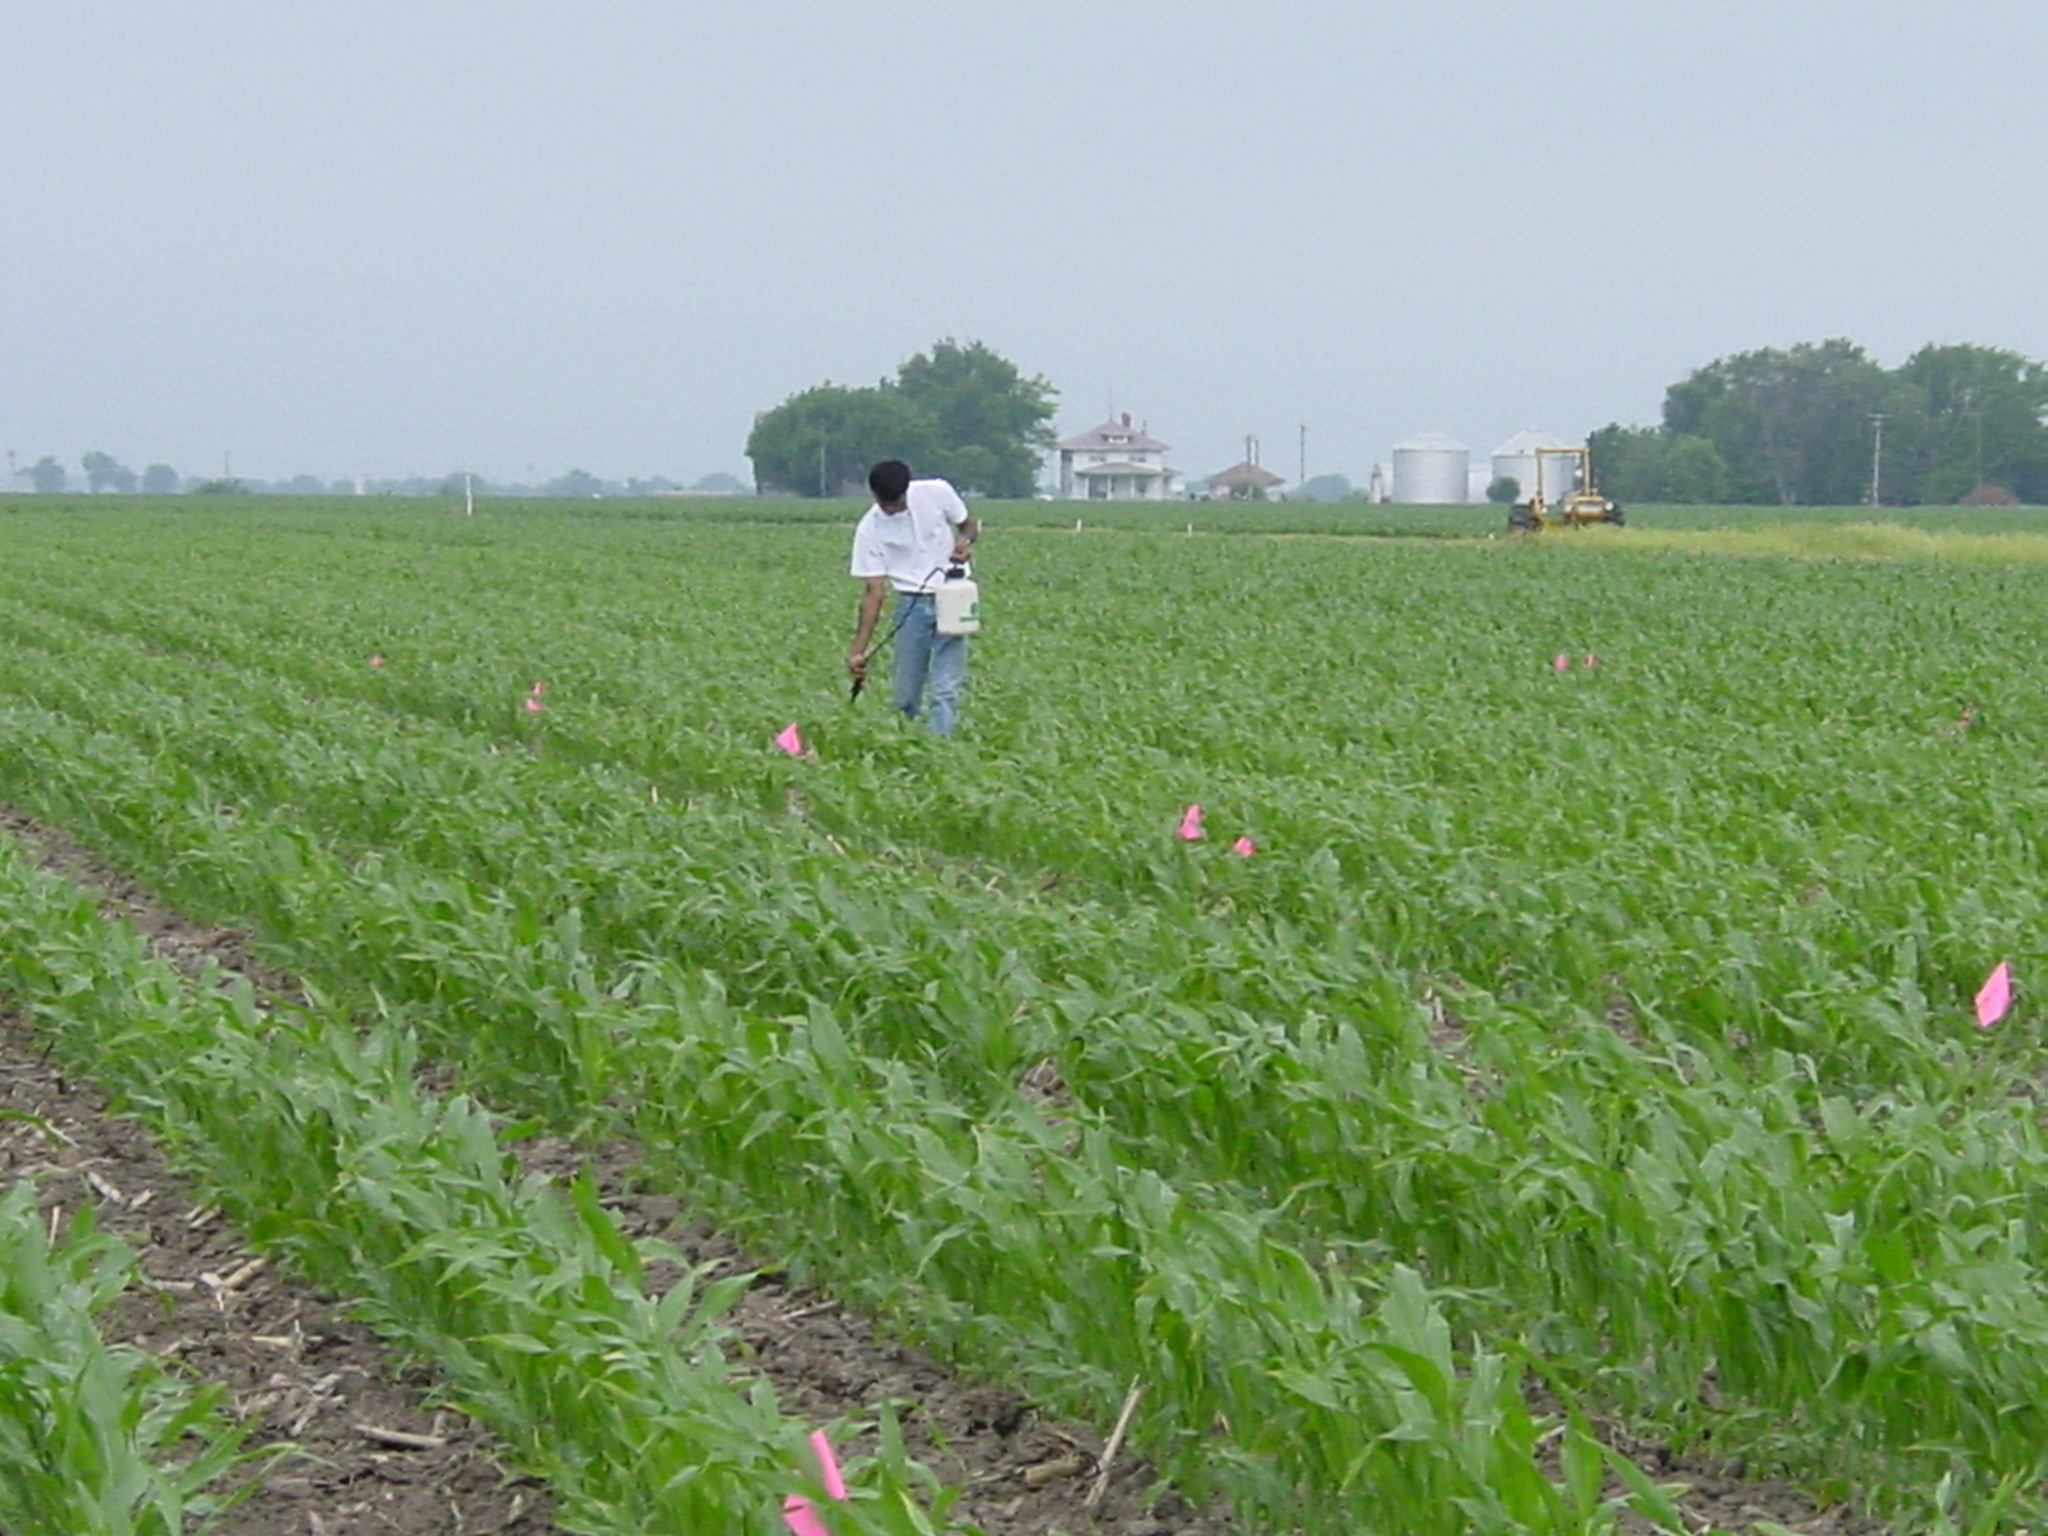
Dr. Jagadeesh Mosali applies fixed N rates in a collaborative corn trial with Dr. Dennis Francis and Dr. Jim Schepers (MSEA site, near Shelton, NE), June 11, 2002

