| Research Highlights, Precision Sensing Solutions for Improved NUE in Corn and Wheat Production Systems | |||||||||||||||||||||||||||||||||||||||||||||||||||||||||||||||||||||||||||||||||||||||||||||||||||||||||||||||||||||||||||||||||||||||||||||||||||||||||||||||||||||||||||||||||||||||||||||||||||||||||||||||||||||||||||||||||||||||||||||||||||||||||||||||||||||||||||||||||||||||||||||||||||||||||||||||||||||||||||||||||||||||||||||||||||||||||||||||||||||||||||||||||||||||||||||||||||||||||||||||||||||||||||||||||||||||||||||||||||||||||||||||||||||||||||||||||||||||||||||||||||||||||
|
Cotton plant height collected by hand
versus plant height measured using a sonar device. Ninety three
percent of the variation in plant height could be explained using this
indirect method of measurement.
|
|||||||||||||||||||||||||||||||||||||||||||||||||||||||||||||||||||||||||||||||||||||||||||||||||||||||||||||||||||||||||||||||||||||||||||||||||||||||||||||||||||||||||||||||||||||||||||||||||||||||||||||||||||||||||||||||||||||||||||||||||||||||||||||||||||||||||||||||||||||||||||||||||||||||||||||||||||||||||||||||||||||||||||||||||||||||||||||||||||||||||||||||||||||||||||||||||||||||||||||||||||||||||||||||||||||||||||||||||||||||||||||||||||||||||||||||||||||||||||||||||||||||||
|
July 17, 2006 Wheat OFIT (On-farm INSEY trials) results, 2006 Table 1. Nitrogen fertilizer applied for Wheat OFIT 2006 across sites, OK.
Table 2. Grain Yield for Wheat OFIT 2006 across sites, OK.
Table 3. Profit earned for Wheat OFIT 2006 across sites, OK.
Preplant N fertilizer
price lb-1: $ 0.40 3 Point Trials
2006 Table 1. Nitrogen use efficiency and N fertilizer applied for 2006 Wheat 3 PT Trial at Efaw, Hennessey and Chickasha, OK.
* UAN – 28% N Table 2. Nitrogen fertilizer, grain yield and profit for 2006 Wheat 3 PT trial at Efaw, Hennessey and Chickasha, OK.
Preplant N price lb-1:
$ 0.40
|
|||||||||||||||||||||||||||||||||||||||||||||||||||||||||||||||||||||||||||||||||||||||||||||||||||||||||||||||||||||||||||||||||||||||||||||||||||||||||||||||||||||||||||||||||||||||||||||||||||||||||||||||||||||||||||||||||||||||||||||||||||||||||||||||||||||||||||||||||||||||||||||||||||||||||||||||||||||||||||||||||||||||||||||||||||||||||||||||||||||||||||||||||||||||||||||||||||||||||||||||||||||||||||||||||||||||||||||||||||||||||||||||||||||||||||||||||||||||||||||||||||||||||
February
22, 2006
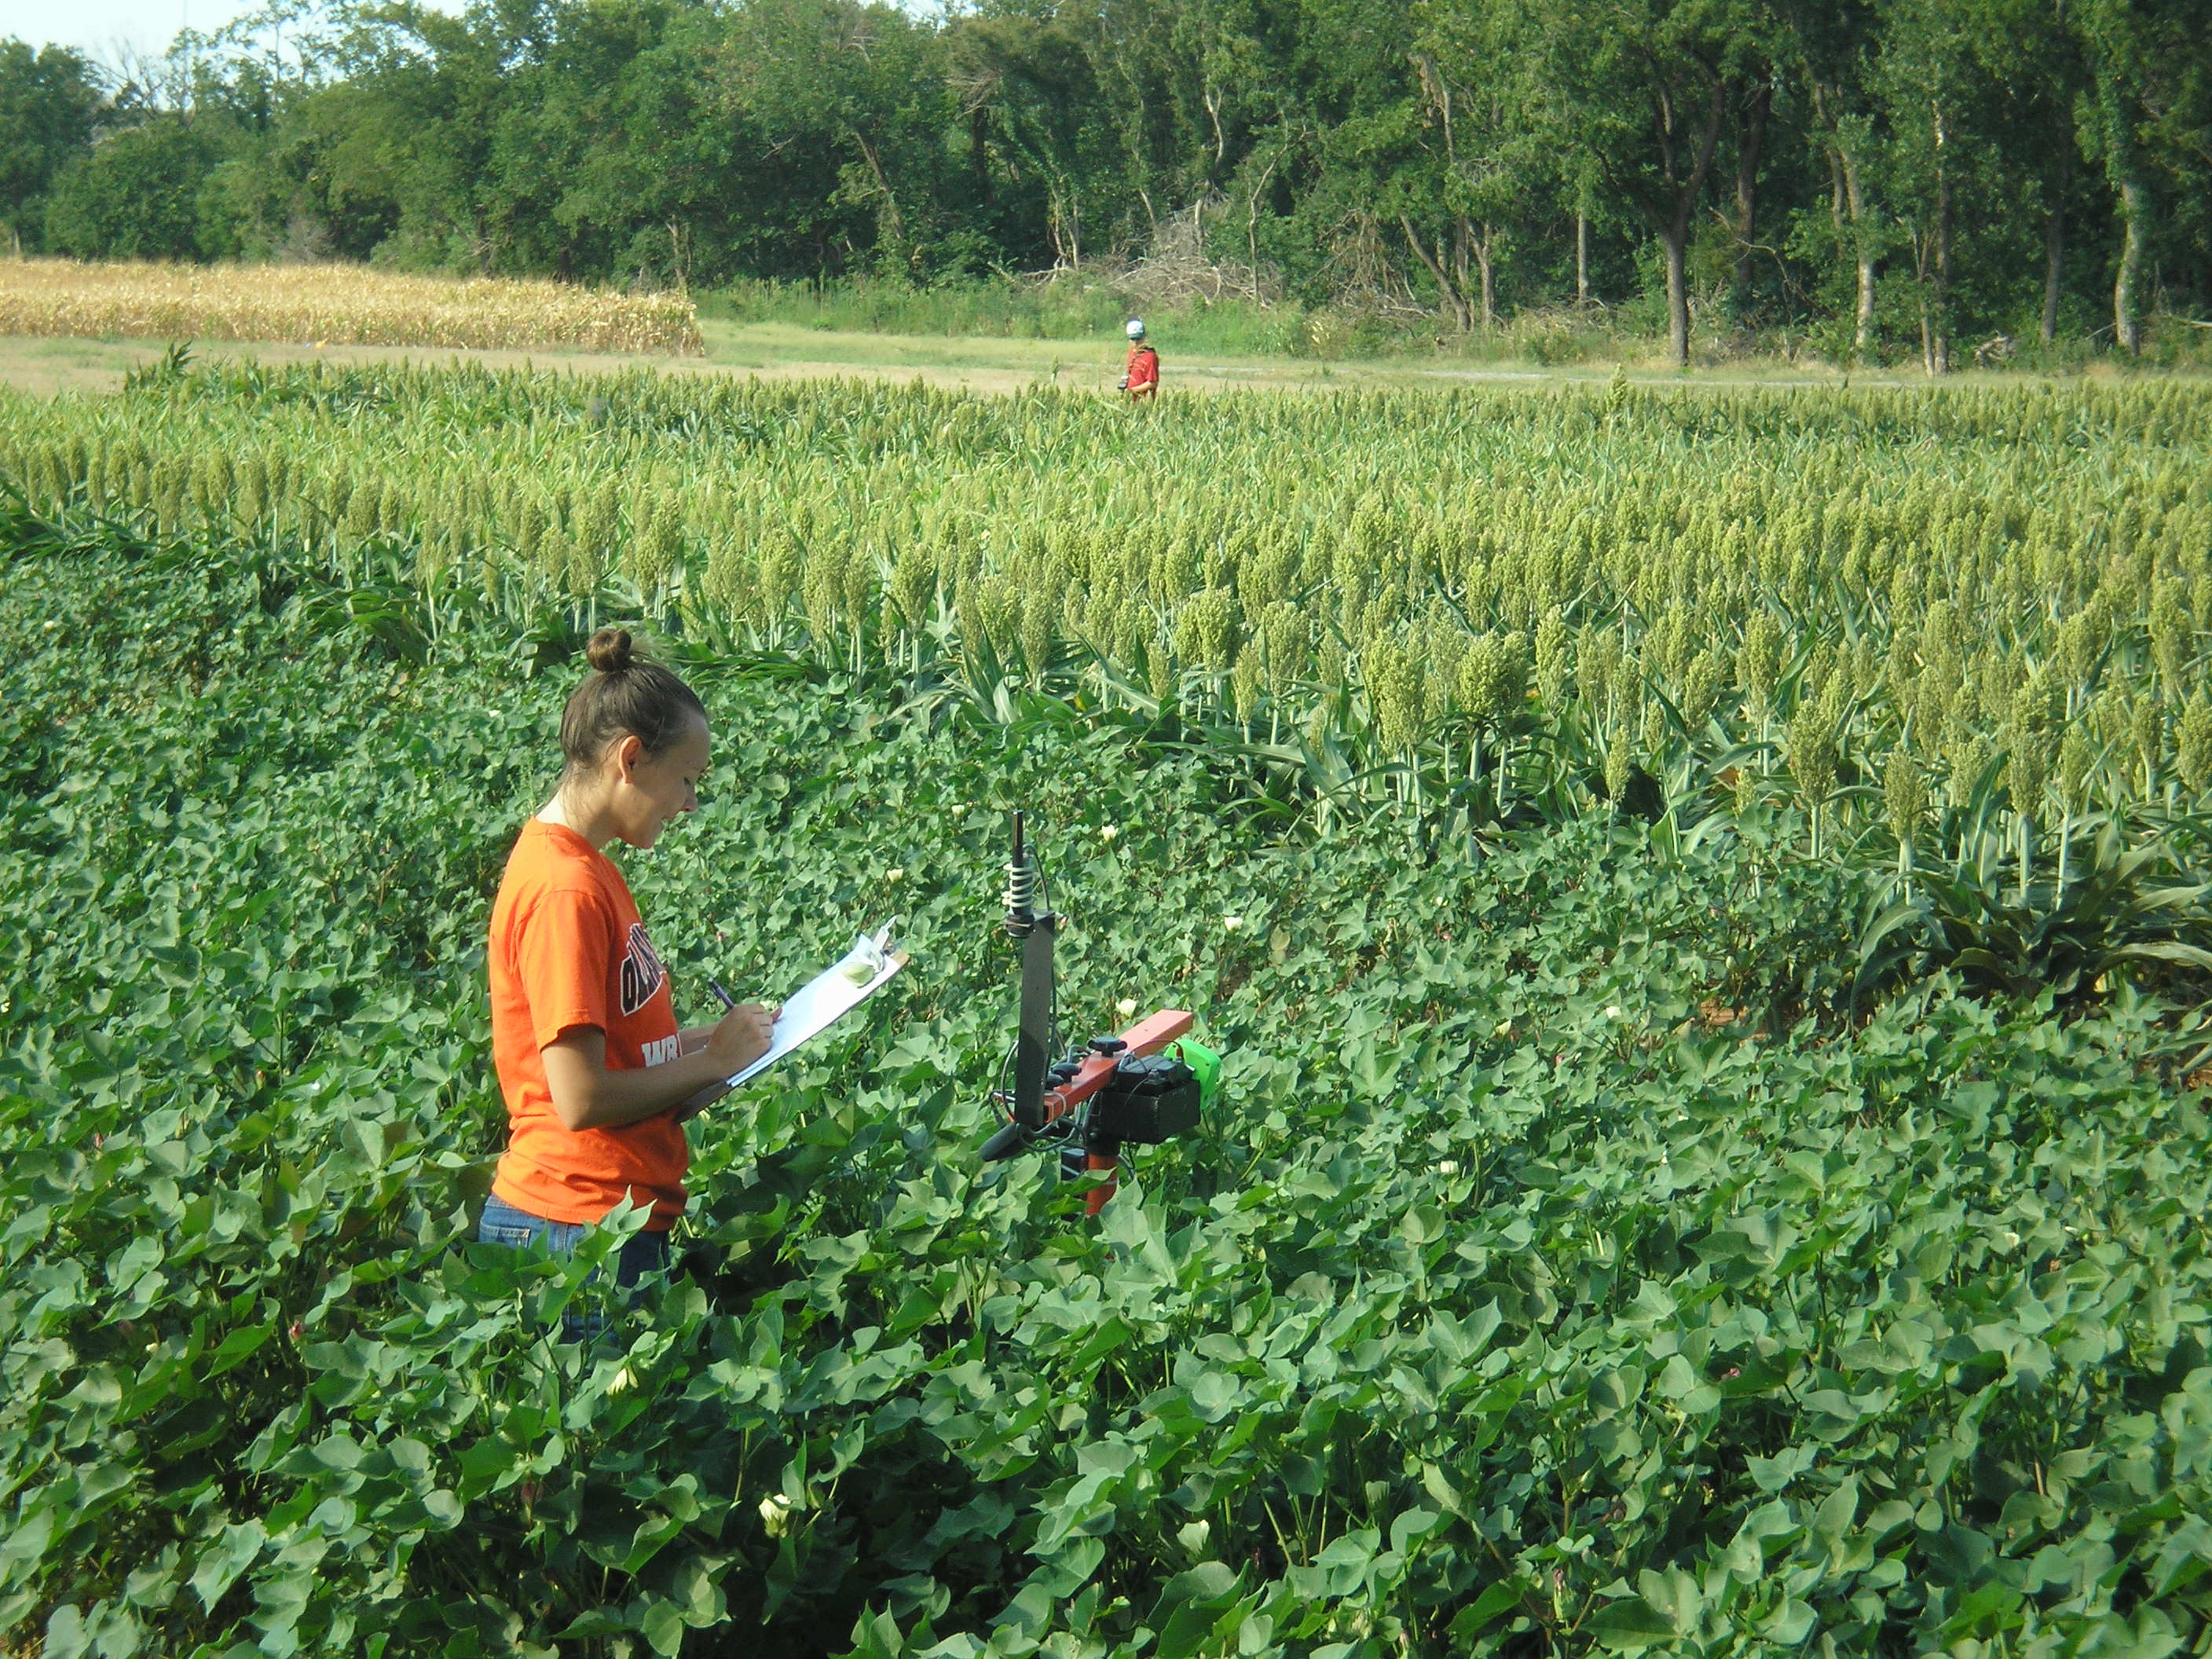
The Sensor Based Nitrogen Calculator now has 15 functional algorithms for corn, wheat, canola, sorghum and bermudagrass. |
|||||||||||||||||||||||||||||||||||||||||||||||||||||||||||||||||||||||||||||||||||||||||||||||||||||||||||||||||||||||||||||||||||||||||||||||||||||||||||||||||||||||||||||||||||||||||||||||||||||||||||||||||||||||||||||||||||||||||||||||||||||||||||||||||||||||||||||||||||||||||||||||||||||||||||||||||||||||||||||||||||||||||||||||||||||||||||||||||||||||||||||||||||||||||||||||||||||||||||||||||||||||||||||||||||||||||||||||||||||||||||||||||||||||||||||||||||||||||||||||||||||||||
|
October
5, 2005 Can corn "catch up" when N fertilization is delayed until V6, V10, or VT growth stages? If no N is applied preplant, it is unlikely that you can produce near maximum yields when N is delayed until V10 growth stages or later. Ideally, a minimum amount of N is required preplant, with added N applied at or before V10. The highest NUE's were in general observed from mid-season N applications. When N fertilization was delayed until VT, grain yields were significantly reduced. Table 1. Treatment, Grain Yield, Grain N uptake, and NUE, for Efaw, Oklahoma, 2005.
Table 3. Treatment, Grain Yield, Grain N uptake, and NUE, for Haskell, Oklahoma, 2005.
|
|||||||||||||||||||||||||||||||||||||||||||||||||||||||||||||||||||||||||||||||||||||||||||||||||||||||||||||||||||||||||||||||||||||||||||||||||||||||||||||||||||||||||||||||||||||||||||||||||||||||||||||||||||||||||||||||||||||||||||||||||||||||||||||||||||||||||||||||||||||||||||||||||||||||||||||||||||||||||||||||||||||||||||||||||||||||||||||||||||||||||||||||||||||||||||||||||||||||||||||||||||||||||||||||||||||||||||||||||||||||||||||||||||||||||||||||||||||||||||||||||||||||||
|
July
13, 2005 When evaluating yield level as a function of nitrogen use efficiency in the long-term continuous winter wheat trials, we found that NUE increases with increasing yield level. Furthermore, this relationship was more pronounced as annual fertilizer N rates increased. The importance of this work is that it will allow us to adjust mid-season NUE's based on predicted yield levels that can be predicted from mid-season NDVI readings.
The same relationship observed between yield level and NUE was also observed for RI and NUE. Thus, altering NUE as a function of predicted RI, or predicted yield level will be a next step toward improving the mid-season SBNRC. |
|||||||||||||||||||||||||||||||||||||||||||||||||||||||||||||||||||||||||||||||||||||||||||||||||||||||||||||||||||||||||||||||||||||||||||||||||||||||||||||||||||||||||||||||||||||||||||||||||||||||||||||||||||||||||||||||||||||||||||||||||||||||||||||||||||||||||||||||||||||||||||||||||||||||||||||||||||||||||||||||||||||||||||||||||||||||||||||||||||||||||||||||||||||||||||||||||||||||||||||||||||||||||||||||||||||||||||||||||||||||||||||||||||||||||||||||||||||||||||||||||||||||||
![]() |
|||||||||||||||||||||||||||||||||||||||||||||||||||||||||||||||||||||||||||||||||||||||||||||||||||||||||||||||||||||||||||||||||||||||||||||||||||||||||||||||||||||||||||||||||||||||||||||||||||||||||||||||||||||||||||||||||||||||||||||||||||||||||||||||||||||||||||||||||||||||||||||||||||||||||||||||||||||||||||||||||||||||||||||||||||||||||||||||||||||||||||||||||||||||||||||||||||||||||||||||||||||||||||||||||||||||||||||||||||||||||||||||||||||||||||||||||||||||||||||||||||||||||
|
June 13, 2005 Natural variability within corn (Zea mays L.) production systems is a common observance, but the resolution at which this variability occurs and methods for mid-season management fail to factor in the spatial difference among corn plants. The objective of this study was to estimate final grain yield of each corn plant by collecting the normalized difference vegetative index (NDVI) sensor data using a GreenSeeker™ optical instrument and plant height at the 8 leaf growth stage (V8). NDVI readings were collected every 1.2 cm in rows 15 to 30 m in length. Knowing the exact location of each plant, average NDVI values were calculated using half the distance between it and its neighbors and computing the respective mean for each plant. As NDVI values were collected, it was clear that differences in plants could be detected using an optical sensor. Grain yield and height determined >66 days earlier at the V8 growth stage was then obtained for each plant and was used to find a relationship with NDVI. Using NDVI alone at V8 was useful in predicting final grain yield, but by adding height at V8, grain yield prediction was significantly improved from an R2 of 0.27 to 0.51.
|
|||||||||||||||||||||||||||||||||||||||||||||||||||||||||||||||||||||||||||||||||||||||||||||||||||||||||||||||||||||||||||||||||||||||||||||||||||||||||||||||||||||||||||||||||||||||||||||||||||||||||||||||||||||||||||||||||||||||||||||||||||||||||||||||||||||||||||||||||||||||||||||||||||||||||||||||||||||||||||||||||||||||||||||||||||||||||||||||||||||||||||||||||||||||||||||||||||||||||||||||||||||||||||||||||||||||||||||||||||||||||||||||||||||||||||||||||||||||||||||||||||||||||
May 11, 2005 (copy from Growing Point
Magazine, March 2005)![]() |
|||||||||||||||||||||||||||||||||||||||||||||||||||||||||||||||||||||||||||||||||||||||||||||||||||||||||||||||||||||||||||||||||||||||||||||||||||||||||||||||||||||||||||||||||||||||||||||||||||||||||||||||||||||||||||||||||||||||||||||||||||||||||||||||||||||||||||||||||||||||||||||||||||||||||||||||||||||||||||||||||||||||||||||||||||||||||||||||||||||||||||||||||||||||||||||||||||||||||||||||||||||||||||||||||||||||||||||||||||||||||||||||||||||||||||||||||||||||||||||||||||||||||
![]()
|
|||||||||||||||||||||||||||||||||||||||||||||||||||||||||||||||||||||||||||||||||||||||||||||||||||||||||||||||||||||||||||||||||||||||||||||||||||||||||||||||||||||||||||||||||||||||||||||||||||||||||||||||||||||||||||||||||||||||||||||||||||||||||||||||||||||||||||||||||||||||||||||||||||||||||||||||||||||||||||||||||||||||||||||||||||||||||||||||||||||||||||||||||||||||||||||||||||||||||||||||||||||||||||||||||||||||||||||||||||||||||||||||||||||||||||||||||||||||||||||||||||||||||
|
May 4, 2005 Improving nitrogen use efficiency (NUE) with remote sensing devices is an emerging technology. This study characterized grain yield and biomass yield of corn (Zea mays L.) and evaluated the spatial variability of corn growth in terms of normalized difference vegetative index (NDVI). Four rows, 30 m in length from two locations over two years were randomly selected for this study. A GreenSeeker™ Handheld sensor was used to collect NDVI readings at all possible growth stages during the life cycle of corn. NDVI increased with progression of vegetative growth stages until V10, where a plateau was encountered, followed by a decline in NDVI after the VT growth stage. Coefficient of variation (CV) data from the NDVI readings of each row revealed two dominant peaks during the life cycle of corn, one between the V6 and V8 growth stages and the second during the late reproductive growth stages. The CV data illustrated that the greatest variation expressed by corn during the vegetative growth stages was between the V6 and V8 growth stages. The highest correlation of NDVI with corn grain yield was found at the V7 to V9 growth stages, while CV and plant spacing had the highest correlation from the V7 to V9 growth stages. The CV also had a high correlation with grain and biomass yields at all growth stages. As remote sensing technology progresses, results indicate that the V8 growth stage will be vitally important as a physiological stage to best recognize spatial variability for nutrient application in corn.
|
|||||||||||||||||||||||||||||||||||||||||||||||||||||||||||||||||||||||||||||||||||||||||||||||||||||||||||||||||||||||||||||||||||||||||||||||||||||||||||||||||||||||||||||||||||||||||||||||||||||||||||||||||||||||||||||||||||||||||||||||||||||||||||||||||||||||||||||||||||||||||||||||||||||||||||||||||||||||||||||||||||||||||||||||||||||||||||||||||||||||||||||||||||||||||||||||||||||||||||||||||||||||||||||||||||||||||||||||||||||||||||||||||||||||||||||||||||||||||||||||||||||||||
|
April 25, 2005 Farmer video discussing the benefits of the N Rich Strip Program implemented in Oklahoma.
|
|||||||||||||||||||||||||||||||||||||||||||||||||||||||||||||||||||||||||||||||||||||||||||||||||||||||||||||||||||||||||||||||||||||||||||||||||||||||||||||||||||||||||||||||||||||||||||||||||||||||||||||||||||||||||||||||||||||||||||||||||||||||||||||||||||||||||||||||||||||||||||||||||||||||||||||||||||||||||||||||||||||||||||||||||||||||||||||||||||||||||||||||||||||||||||||||||||||||||||||||||||||||||||||||||||||||||||||||||||||||||||||||||||||||||||||||||||||||||||||||||||||||||
|
Tom Denker, Farmer near Enid, OK Question: What is the benefit of GreenSeeker Technology? Question: What do you think about OSU working with private industry to make this type of technology available to producers? Question: Would you like to add anything?
March 10, 2005
|
|||||||||||||||||||||||||||||||||||||||||||||||||||||||||||||||||||||||||||||||||||||||||||||||||||||||||||||||||||||||||||||||||||||||||||||||||||||||||||||||||||||||||||||||||||||||||||||||||||||||||||||||||||||||||||||||||||||||||||||||||||||||||||||||||||||||||||||||||||||||||||||||||||||||||||||||||||||||||||||||||||||||||||||||||||||||||||||||||||||||||||||||||||||||||||||||||||||||||||||||||||||||||||||||||||||||||||||||||||||||||||||||||||||||||||||||||||||||||||||||||||||||||
|
February 28, 2005 To achieve genetic yield potential, stands must be optimum, plant spacing must be exact, seed must be planted at ideal and uniform depth, all nutrients must be non-limiting, soil types must be ideal for the cultivar, and moisture, temperature, and all other environmental factors must be ideal during the entire growing season. All plants must emerge within one day. All plants must set at least one ear of corn and the ear must completely fill. Under these conditions, the range of yield and standard deviation of yield should theoretically approach zero. Consequently, the upper boundary of regression curves fitted for the data reported must approach zero at the genetic yield potential. Similarly, both the range and standard deviation of yield should be small near zero-yield to satisfy results reported by Taylor et al., (1999), and Dobermann et al., (2003). Seed suppliers do not normally publish
genetic yield potential data. However, the National Corn Growers
Association Corn Yield Contest results (www.NCGA.com) can serve as a
surrogate for these data. In order to achieve maximum yields, contest
participants attempt to manage all factors under their control to minimize
reduction in corn yield from the cultivars genetic yield potential. First
place yields for all classes from 2002, 2003, and 2004 ranged from 19,000
to 22,000kg ha-1. One can infer that these yields approached the genetic
yield potential of the corn cultivars, and where by-plant variability
would be low. The standard deviation curve peaked near
13000 kg ha-1 and declined at higher yields. However, most of that decline
occurred at yields greater than 15000 kg ha-1. Average field scale corn
yields in all areas reported in this paper were much less than 15000 kg
ha-1. Clearly, by-plant corn yield variability is large within the yield
ranges achieved by producers, and that was delineated to in the by-state
and country averages. |
|||||||||||||||||||||||||||||||||||||||||||||||||||||||||||||||||||||||||||||||||||||||||||||||||||||||||||||||||||||||||||||||||||||||||||||||||||||||||||||||||||||||||||||||||||||||||||||||||||||||||||||||||||||||||||||||||||||||||||||||||||||||||||||||||||||||||||||||||||||||||||||||||||||||||||||||||||||||||||||||||||||||||||||||||||||||||||||||||||||||||||||||||||||||||||||||||||||||||||||||||||||||||||||||||||||||||||||||||||||||||||||||||||||||||||||||||||||||||||||||||||||||||
|
February 1, 2005 The relationship between plant population and CV from GreenSeeker NDVI readings was evaluated over 7 site-years. From this evaluation, a critical CV of 20 was determined using a linear-plateau model. When CVs were greater than 20, the plant population was poor with < 100 plants/m2. The ability of the crop to respond to added N was evaluated using several response indices (RIHarvest, RINDVI, RINDVI-CV). It was found that RINDVI-CV (NDVI of the N-rich plot / (NDVI of the check * SqRt of check CV)) provided improved prediction of RIHarvest compared to the conventional RINDVI (NDVI of the N-rich plot/NDVI of the check). It is suggested that when this is implemented into the algorithm, variable rate applicators will apply less N over areas that have CVs greater than 20. The reduction in N applied reduces the expense of farmers and risk of N being lost to the environment. ![]() Figure 1. Relationship between the CV of NDVI readings and winter wheat plant population (7 locations, 2003-2004, multiple seeding rates and 6 varieties). The observation that CV reached a peak at Feekes 5 to 6 suggests that current timing of application may have to be changed in order to maximize the efficiency of the technology. As to application direction, it was beneficial to see that it does not matter what direction the sensors are traveling across the seed row and that the NDVI values will remain the same. This is extremely important in that the applicators do not have the need to follow any rigid guidelines for the equipment to perform properly.
|
|||||||||||||||||||||||||||||||||||||||||||||||||||||||||||||||||||||||||||||||||||||||||||||||||||||||||||||||||||||||||||||||||||||||||||||||||||||||||||||||||||||||||||||||||||||||||||||||||||||||||||||||||||||||||||||||||||||||||||||||||||||||||||||||||||||||||||||||||||||||||||||||||||||||||||||||||||||||||||||||||||||||||||||||||||||||||||||||||||||||||||||||||||||||||||||||||||||||||||||||||||||||||||||||||||||||||||||||||||||||||||||||||||||||||||||||||||||||||||||||||||||||||
|
January 25, 2005
Is "plant to plant" variability the same whether fixed distances are
used between plants or using actual measured distances? Turns out that
the expressed variability
is actually greater when using fixed distances that do not accurately
reflect computed yields based on the area occupied. Experiments documenting by-plant differences in corn grain yield show that variability increases as yield levels increase. This work shows that regardless of yield level, the average hybrid corn grain yield difference from one plant to the next exceeds 2740 kg/ha or 44 bu/ac in producer fields. |
|||||||||||||||||||||||||||||||||||||||||||||||||||||||||||||||||||||||||||||||||||||||||||||||||||||||||||||||||||||||||||||||||||||||||||||||||||||||||||||||||||||||||||||||||||||||||||||||||||||||||||||||||||||||||||||||||||||||||||||||||||||||||||||||||||||||||||||||||||||||||||||||||||||||||||||||||||||||||||||||||||||||||||||||||||||||||||||||||||||||||||||||||||||||||||||||||||||||||||||||||||||||||||||||||||||||||||||||||||||||||||||||||||||||||||||||||||||||||||||||||||||||||