

Covariance and Autocorrelation
COVARIANCE example for bird damage in Sorghum Plots
You first need to collect data (score of 1 to 10, or 0 to 100, or
some other scale that can take qualitative data to a quantitative scale).
X person needs to know what 1 means and what 10 means. 10 would for me
mean significant damage. We need to “gauge damage” but using
individual people. If you want to add x-person, you can then compare
them, but both need to be first instructed as to what the agreed-upon-scale
meant.
Also, and unfortunately, the individual scoring the damage has to
have his/her values for all plots. ALL 72 plots where an independent
score was recorded by that person.
How can this data be used. First, if we plan on using this
as a covariate, we must first analyze our “bird-damage” data as a dependent
variable in the model. If for instance the independent effect of
treatment in the model was significant for “bird-damage” , then
“bird-damage” cannot be used as a covariate. If “bird damage”
is found to be independent of treatment, it can be used as a covariate to
remove this source of variability, and that allows the researcher to better
detect treatment differences using their dependent variable (e.g., grain
yield).
Covariance can be viewed as a linear regression adjustment,
within an analysis of variance model.
We cover all of this in the Experimental Methods class that will
be taught in the spring of 2019. For this data, I will work with those
interested to properly employ the covariate.
But, you have to remember, that “bird-damage”
could actually be
influenced by treatment. Maybe the birds preferred the high N plots.
You just don’t know. Also, this bird-damage data may not be
normally distributed which throws and additional wrench into the mix, since
non-parametric statistics would then be in order.
For taking scores, or ranks, you just have to apply the “score” number to
the exact same area that would be harvested. If I am going to harvest
all of the center 2 rows, then the score has to be my “view” or my “rank” of
that very same area.
These areas (harvest and rating) have to be the same, and that makes sense.
If the score and harvested area are different, how could I match final
values up? Obviously you cant.
So, give those 2 center rows that you will harvest, your “mental average” score. '
Should I generate scores from two different individuals on damage? Run them separately as covariates?
EXAMPLE:
Would these values work? With 2-4
and 6-9 being in between values?
1 - no damage
5 - 50% loss of grain
10 -
complete loss of grain
For me this is not appropriate because I seriously
doubt you have plots that have 100% damage (a total loss). Ten has to be
the plot with the most damage of all plots. A score of 1 has to be a
plot that has the least amount of damage.
You have to remember that you are entering a “score” for bird damage.
Nothing else. If a plot is going to yield zero-grain, but where the
reason for that damage score of 10 has nothing to do with “bird damage” then
that plot’s bird damage score has to be zero.
data one; input loc $ rep trt score yld;
cards;
EFAW 1 1 1 4.172467842
EFAW 1 2 1 5.809007482
EFAW 1 3 1 5.325708055
EFAW 1 4 1 7.205499074
EFAW 1 5 1 7.736446123
EFAW 1 6 2 6.75440387
EFAW 1 7 1 7.66826357
EFAW 1 8 2 5.826040013
EFAW 1 9 1 7.16472762
EFAW 1 10 1 8.647987937
EFAW 1 11 1 7.947073382
EFAW 1 12 2 6.531951129
EFAW 2 1 1 3.302389924
EFAW 2 2 1 4.074529335
EFAW 2 3 2 6.578584877
EFAW 2 4 1 4.784524348
EFAW 2 5 1 1.276861579
EFAW 2 6 1 5.035148482
EFAW 2 7 1 4.999456874
EFAW 2 8 1 4.980246697
EFAW 2 9 1 3.344957309
EFAW 2 10 1 5.522799872
EFAW 2 11 1 5.740105067
EFAW 2 12 1 2.821315273
EFAW 3 1 1 3.988830645
EFAW 3 2 1 2.761136063
EFAW 3 3 2 4.821103296
EFAW 3 4 1 6.068641054
EFAW 3 5 2 5.703061566
EFAW 3 6 2 6.263577978
EFAW 3 7 1 5.915862371
EFAW 3 8 1 6.00198225
EFAW 3 9 1 4.243763648
EFAW 3 10 2 6.500921231
EFAW 3 11 1 7.179428377
EFAW 3 12 2 6.538540067
LCB 1 1 2 5.655882526
LCB 1 2 2 7.163848857
LCB 1 3 2 5.79625248
LCB 1 4 3 7.893927624
LCB 1 5 5 8.562844148
LCB 1 6 5 9.03617542
LCB 1 7 1 5.187611913
LCB 1 8 2 8.532728297
LCB 1 9 2 7.84532925
LCB 1 10 3 7.887392674
LCB 1 11 4 9.328681845
LCB 1 12 3 9.049988716
LCB 2 1 1 4.165793306
LCB 2 2 4 7.503853017
LCB 2 3 4 7.595765585
LCB 2 4 4 7.358587957
LCB 2 5 5 8.526402937
LCB 2 6 3 8.72137655
LCB 2 7 2 4.779970235
LCB 2 8 3 7.730226834
LCB 2 9 3 7.583431838
LCB 2 10 4 8.903242919
LCB 2 11 6 9.074334694
LCB 2 12 3 8.922225361
LCB 3 1 2 5.92788277
LCB 3 2 4 6.798394452
LCB 3 3 2 6.598045047
LCB 3 4 4 7.89878046
LCB 3 5 4 9.285757316
LCB 3 6 4 7.909769048
LCB 3 7 1 4.214283074
LCB 3 8 2 7.332422217
LCB 3 9 2 6.37976641
LCB 3 10 4 7.180812325
LCB 3 11 4 9.127999641
LCB 3 12 5 7.876696768
data two; set one;
Proc sort; by loc;
proc glm; by loc;
class rep trt;
model score yld = rep trt;
means trt;
run;
proc glm; by loc;
class rep trt;
model yld = rep trt score;
lsmeans trt;
run;
Proc Corr;
data one;
input red nir NDVI yield height;
cards;
.5 .6 .7 4000 32
.4 .7 .8 5000 39
.5 .8 .9 5500 41
.4 .5 .7 3500 30
.3 .5 .6 3400 29
.2 .4 .5 2200 25
.24 .45 .55 2400 28
.29 .46 .58 2600 29
proc corr;
var red nir NDVI yield height;
run;
proc corr;
var red nir;
with yield;
run;
"Autocorrelation" if red is correlated with NDVI, what does this
mean?
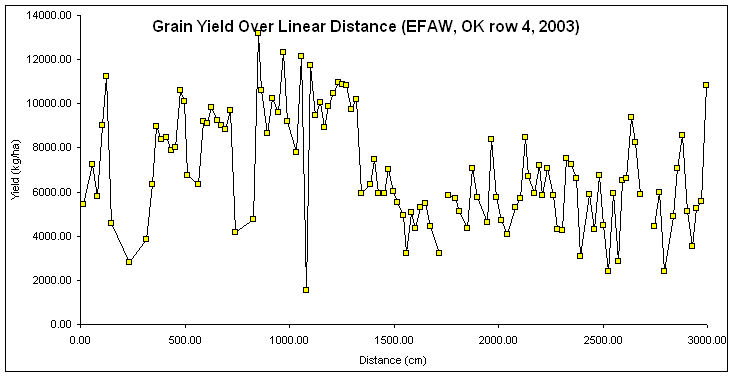
Is this "Autocorrelation" plotting yield as a function of distance, since
distance (x) was used to compute yield (y)?
Covariance (go to RCBD example, #222, use GN as a covariate)
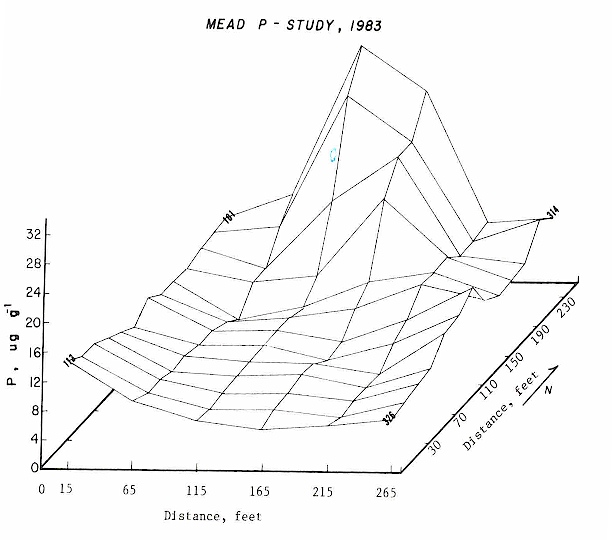
Rule: You have to run anova using preplant P as a dependent variable FIRST. Why? Because you have to establish that "treatment" was not significant when using your potential covariate as a dependent variable. In essence the covariate has to be "RANDOM". Your potential covariate has to be independent of treatment and the only way to establish this is to use as a dependent variable in your model. Once you establish that your covariate is independent of treatment, you can legitimately use it.
data one;
input rep nrate tillage yield preP;
cards;
1 0 0 20
16
1 50 0 25 13
1 100 0 29 13
1 150 0 35 14
1 0 1 35 18
1 50 1 35 16
1 100 1 38 11
1 150 1 39 19
2 0 0 20 22
2 50 0
26 23
2 100 0 30 21
2 150 0 32 25
2 0 1 36 19
2 50 1 36 11
2 100 1 37 18
2 150 1 40 16
3 0 0 17 28
3 50 0 22 19
3
100 0 25 28
3 150 0 29 22
3 0 1 29 23
3 50 1 34 25
3 100 1
38 24
3 150 1 40 18
proc print;
proc glm;
class tillage nrate;
model preP = nrate tillage nrate*tillage;
means nrate tillage nrate*tillage;
run;
proc glm;
class tillage nrate;
model
yield = nrate tillage
nrate*tillage;
means nrate tillage nrate*tillage;
run;
proc glm;
class tillage nrate;
model
yield = nrate tillage nrate*tillage
preP;
lsmeans nrate tillage nrate*tillage;
run;