Mexico Sensor Results,
Growth Stage where Differences are best detected, use of the CV
RICE, flooded
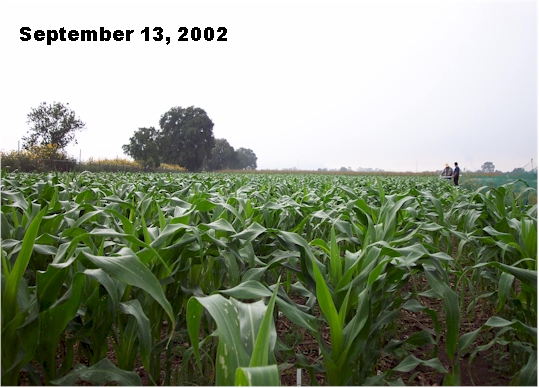
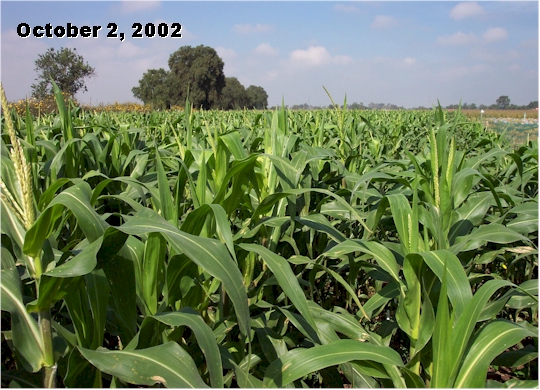
Figure X. Coefficient of variation from NDVI readings taken over time from 4 different corn rows, 27 m in length, Texcoco, MX. The average number of sensor readings per meter is 18.
The date where CV's start to decrease coincide with the physiological stage where the in-row canopy begins to close. Recognition of the point where the maximum amount of variability is expressed might also be the time where variable rate treatments will have the greatest benefit.
September 6th, 2002, Corn Sensor Readings
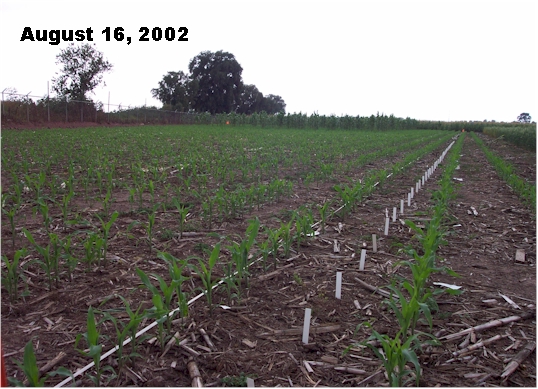
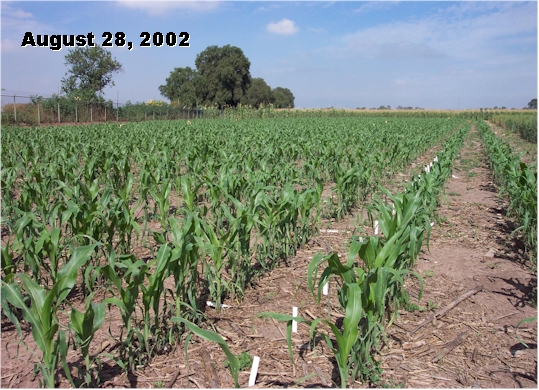
Single row (27 m in length, 125 individual corn plants) NDVI readings collected at different stages of growth, beginning on the 12th of August, 2002 (V4), to August 28th (V7).
When does a corn plant in monoculture corn become a weed?
By plant NDVI readings from corn, V12, Texcoco Mexico (above) and picture
of the same corn row below
The chart above plots cumulative distance (actual location of plants) and NDVI. We will use some of this information to predict distance between plants using sensor readings.
| Table 1. Treatment structure including preplant and foliar applications of KH2PO4 | |||||||
| for spring wheat production, Ciudad Obregon, Sonora, MX | |||||||
| Trt | Preplant P | Method | Foliar P | Growth Stage | Grain Yield | Grain P | Grain N |
| kg/ha | kg/ha | kg/ha | kg/ha | kg/ha | |||
| 1 | 0 | - | 0 | - | 6650 | 10.4 | 109 |
| 2 | 0 | - | 2.5 | Feekes 6 | 6470 | 11.4 | 104.7 |
| 3 | 0 | - | 5 | Feekes 6 | 6954 | 12.3 | 116.3 |
| 4 | 0 | - | 10 | Feekes 6 | 6750 | 11 | 111 |
| 5 | 60 | BRP | 0 | - | 7332 | 14.3 | 125.3 |
| 6 | 60 | BRP | 2.5 | Feekes 6 | 7372 | 14.3 | 124 |
| 7 | 60 | BRP | 5 | Feekes 6 | 7754 | 14.9 | 132.7 |
| 8 | 60 | BRP | 10 | Feekes 6 | 7475 | 14 | 127.3 |
| 9 | 0 | - | 5 | Feekes 10 | 6897 | 12 | 116.3 |
| 10 | 60 | BRP | 5 | Feekes 10 | 7448 | 13.8 | 125 |
| 11 | 0 | - | 5 | Feekes 10.5 | 6903 | 12.4 | 115.7 |
| 12 | 60 | BRP | 5 | Feekes 10.5 | 7842 | 15.3 | 135.3 |
| 13 | 60 | BA | 0 | - | 7206 | 12.4 | 119.7 |
| 14 | 60 | BA | 5 | Feekes 6 | 7091 | 13.2 | 120 |
| SED | 154 | 0.8 | 4.6 | ||||
| BRP, P applied broadcast preplant as 0-20-0 (N-P-K) | |||||||
| BA, P band applied at planting as 0-20-0 (N-P-K) | |||||||
A significant and consistent trend for increased wheat grain yields was noted for the 5 kg/ha foliar P application both at the 0 and 60 kg P/ha preplant rate. At the higher 10 kg/ha foliar P rate, no differences were observed.