Managing Nitrogen Fertilizer for Spatial Variability in Wheat Fields.
Gordon
Johnson, Bill Raun,
Departments
of Plant & Soil Sciences and Biosystems and Ag Engineering
Division of
Agricultural Sciences & Natural Resources
PT 2003-7 April 2003 Vol.15, No.7
INTRODUCTION.
Field
“average” is easy to calculate, but only occurs about 1/3 of the time.
More than meets the eye. When nitrogen
(N) fertilizer is applied to wheat fields, the same rate is almost always
applied over the entire field. Farmers
and fertilizer dealers know that differences in yield potential may exist in a
field, based only on visual observation, but until now have not had the
technology to do much about it. Recent research has shown that nutrient availability
in fields may be different for about every 4 ft2. It is often easy to see, and even soil test,
areas of several acres in a field that are different because of landscape
position such as upland, slope, and bottomland.
Areas as small as 4 ft2, however, are too expensive to soil
test and impossible to distinguish by eyesight in a field.
Testing soil
nutrient availability. Soil tests are most valuable for evaluating fertilizer
needs when they are able to mimic, or act like, a plant growing in the
soil. Good soil tests take nutrients out
of the soil in a way that is similar to plants extracting the nutrients. However, even the best soil tests only
accurately identify a portion of the soil-N (nitrate) that plants might use during the growing season. The most reliable ‘tester’ of soil nutrient
availability is the plant itself.
Although plants respond to may factors in the growing environment during
the season, the most common, and expensive, input for wheat production is
nitrogen fertilizer.
Getting
better ‘eyes’. The human eye is a marvel. It literally sees everything. But the human eye cannot focus on only one or
two colors and shut all the rest out.
Consequently, we have difficulty seeing small changes in crop condition
related to yield potential and N nutrition of the crop. Active optical sensors emit light and then
measure the crops reflection of that light in relation to the “healthiness” of
the crop. Recent research has shown that
optical sensors can reliably estimate yield potential and N fertilizer
requirement from red and near infrared light reflected by young (Feekes growth
stage 5) wheat plants mid-season. Small
crop differences (less than 20 %) that we are unable to see are accurately
identified by the sensor.
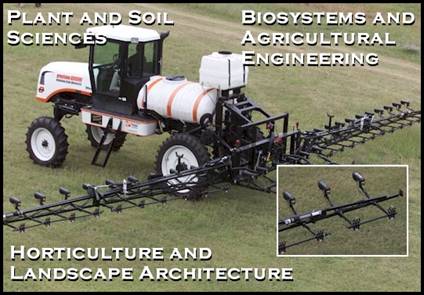
Fertilizing
4 ft2 areas. Once the N fertilizer requirement has been determined
by the sensor, the next step is to be able to fertilize each 4 ft2
area individually. A newly designed
spraying system allows this to be done while traveling at speeds up to 15 miles
per hour (Figure 1).
QUESTIONS
ABOUT SPATIAL VARIABILITY
What is an
N-Rich Strip? Use of mineralized-N by the crop can be estimated only
if the crop has not already received fertilizer-N to meet its entire N
requirement. Thus, the new strategy is
to apply little or no fertilizer-N preplant, or with the seed, except for a
spreader width the length of the field that receives enough preplant (or early
season) fertilizer-N that the crop will not be limited by lack of N. This spreader width application is the N-Rich
Strip for that field.
Where should
the N-Rich Strip be in the field? The N-Rich Strip should be located through a
representative part of the field. If
possible, it is also useful to place the strip where it will be convenient
(after appropriate marking) to periodically observe whether it looks different
from the rest of the field. The strip
should be re-fertilized each year.
How is the
N-Rich Strip compared to the rest of the field?
The N-Rich Strip, and an
adjacent, similar part of the field that did not receive as much fertilizer,
are each individually “read” using an optical, hand-held GreenSeeker
sensor. The sensor, in the on-position,
is held about 38 inches above the crop canopy while walking about 100 paces to
collect an average reading.
When is the
N-Rich Strip read? The N-Rich Strip is read just before topdressing and
will identify the fertilizer rate to use.
Earlier than “normal” topdressing is indicated when wheat in the N-Rich
Strip appears to be in significantly better condition than the rest of the
field. Sensor readings and decisions
about early topdressing should then be made.
When the N-Rich Strip looks the same as the rest of the field, and
sensor readings confirm there is no difference, later sensor readings may be
taken to confirm no fertilizer is needed, or identify that a small amount of
fertilizer may be beneficial.
How is wheat
for pasture managed differently? The major difference is that wheat being managed for
pasture is more likely to respond to a low rate (20 to 40 lb N/acre) of
fertilizer. An N-Rich Strip should still
be established to help determine later topdressing needs.
What exactly
do the sensor readings tell us? Sensor readings, together with the number of days the
crop has been growing, are used to estimate grain yield. The yield without topdress-N, how much N
should be topdressed, and the potential yield with topdressing are all
calculated.
What is the
value of using the N-Rich Strip for making fertilizer recommendations? Research
shows an average profit of $10 to $20/acre using the N-Rich Strip and sensor
readings to determine fertilizer rates compared to using yield goals. The increased profit is related to the fact
that yield goals (averages) are easy to calculate, but are only experienced
about 1/3 of the time. Using the N-Rich
Strip and sensor calculations increase the chance of using the correct rate
each year, and only apply N when it is needed so nitrogen use efficiency is about
doubled.
Oklahoma State University, in compliance with Title VI and Vii of the Civil Rights Act of 1964, Executive Order 11246 as amended, Title IX of the Education Amendments of 1972, Americans with Disabilities Act of 1990, and other federal laws and regulations, does not discriminate on the basis of race, color, national origin, sex, age, religion, disability or status as a veteran in any of its policies, practices or procedures. This includes but is not limited to admissions, employment, financial aid, and educational services.
Issued in furtherance of
Cooperative Extension work, acts of May 8 and