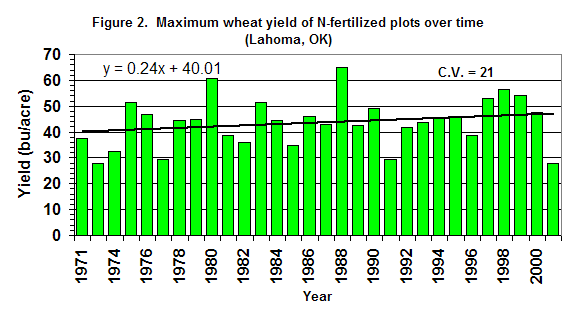
Some years there was less than a 20% increase in yield
from fertilization, other years there was as much as a 300% increase, and there
was no pattern in the changes over time (Fig. 2). The yields of fertilized plots were also
variable over time, but less so (CV= 21%) than the yields observed for
unfertilized plots (CV = 31%) for the 31 year period.
So, how much topdress fertilizer is really needed?
The answer to this question will vary greatly from year
to year depending on what the yield maximum is for the year, and how much of
the nitrogen required for the yield maximum will be provided from
non-fertilizer nitrogen (mineralized soil N).
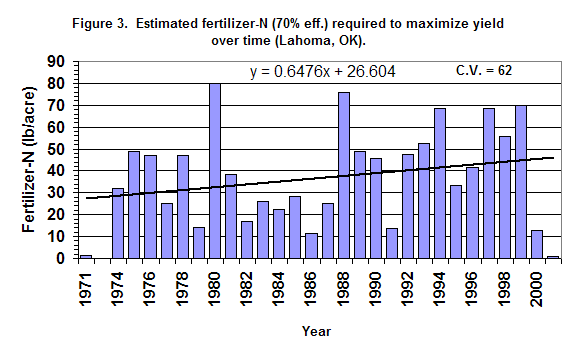
First, we calculate the difference in yield between the maximum yielding
fertilized plots and yield of control (unfertilized) plots. Then, by multiplying that yield increase from
fertilizer times the 2 lb N required to produce a bushel of wheat, we obtain
the amount of nitrogen that should have been applied for maximum yield each
year. As illustrated in Fig 3., that amount varies from year to year even more (CV= 62)
than the control yield or the maximum fertilized yield.
This variation in fertilizer need from year to year is
directly related to the variation in response index from year to year (Fig. 4),
and is the reason why estimating a response index is so critical to identifying
the correct N fertilizer rate.

How is a Response Index for a field calculated?
The first response indexes were calculated by
dividing the yield from unfertilized research plots into the best yielding
fertilized plot for a given year. Recent
research has shown that a reliable response index can be calculated by
comparing the forage growth of fertilized and unfertilized areas of wheat just
before it is time to consider topdressing nitrogen.
The in-season calculation is made by measuring some
crop characteristic that responds to available nitrogen, such as plant height,
and dividing the number obtained from the fertilized area by the number obtained
from the unfertilized area.
But how will farmers have both fertilized and
unfertilized areas in a field?
Through cooperation with their fertilizer dealer,
farmers should arrange to fertilize (preplant) a strip the length of the field
with a rate that is twice the normal preplant nitrogen rate (2X-STRIP). If they don’t plan to put down any preplant
nitrogen then they should arrange for a strip applied at a rate that is 1½
times more than the total applied to the field last year (or is normally applied
to the field). If they have never
applied nitrogen to the field, they should apply a strip at a rate of 80 lb
N/acre. As a general guide, the preplant
nitrogen rate should be only half the total amount of nitrogen the crop
(grazing, grazing plus grain, or grain alone) is expected to need in a high
yielding year.
How can a farmer use the Response Index once it is
known?
Once the response index is calculated, it can then be
multiplied times the preplant rate used for the entire field. This value is an estimate of the total
nitrogen the crop can use. By
subtracting the rate applied preplant from the total the crop can use, the
difference, after adjusting for an uptake efficiency of 70%, results in the
final topdress rate. In some years, it
is likely that the uptake efficiency will be less than 70% for topdress
applications of N. Here is an example:
Preplant
rate for entire field = 40 lb N/acre
2X-STRIP = 80 lb/acre.
Crop
height at X-rate = 12”
Crop
height at 2X-rate = 20”
Response Index = 20/12 = 1.6
Crop
nitrogen need = 1.6 x 40 = 64 lb N/acre
Topdress
need = (crop need – preplant application)/0.70
Topdress
need = (64 – 40) = 24/0.70 = 34 lb N/acre
So, what’s in it for the farmer?
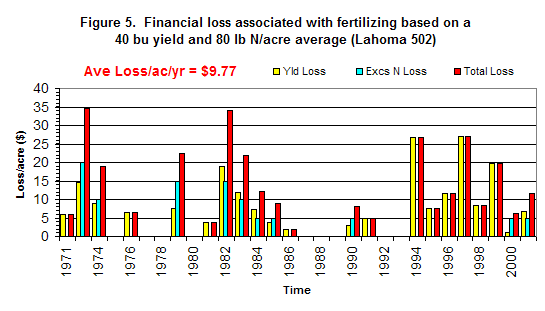
We looked at the yield results from applying 80 lb
N/acre each year (typical for farmers that average 40 bu/acre yields) and
compared those yields to the highest yields (at any rate of N), and the rate of
N required for maximum yields. In some
cases there was a yield increase from a higher rate of N (yield loss at 80 lb rate),
and in some cases there was a higher yield from a lower rate of N (wasted N and
yield loss at 80 lb rate). These losses
were calculated for each year, using a wheat value of $3/bushel and N cost of
$0.25/lb (Fig. 5).
How do farmers ‘cash in’ on this new technology?
Most farmers won’t be able to benefit from this
technology without the services and help of their local fertilizer dealer. By servicing a large number of fields,
fertilizer dealers and crop consultants will become the local experts. Dealers will be responsible for applying the
2x strips that will ultimately serve as the foundation for increasing the
payback from nitrogen inputs through topdressing, also provided by the dealer.
Oklahoma State University, in compliance with Title
VI and Vii of the Civil Rights Act of 1964, Executive Order 11246 as amended,
Title IX of the Education Amendments of 1972, Americans with Disabilities Act
of 1990, and other federal laws and regulations, does not discriminate on the
basis of race, color, national origin, sex, age, religion, disability or status
as a veteran in any of its policies, practices or procedures. This includes but is not limited to
admissions, employment, financial aid, and educational services.
Issued in furtherance of
Cooperative Extension work, acts of May 8 and June 30, 1913, in cooperation with the US
Department of Agriculture, Sam E. Curl, Director
of Oklahoma Cooperative Extension Service, Oklahoma State University, Stillwater, Oklahoma. This publication is printed and issued by Oklahoma State University as authorized by the Dean of the Division of
Agricultural Sciences and Natural Resources.