OSU Long Term Experiments (ALL)
Abstract
Grain yield response of
irrigated winter wheat to fertilization with nitrogen (N), phosphorus (P)
and potassium (K) in a long-term experiment has not been extensively
evaluated. Experiment 406 was
established in 1966 to evaluate fertilizer applications on irrigated
winter wheat grown in southwestern Oklahoma.
Following 34 years of continuous wheat, response to applied N, P,
and K remains somewhat dynamic. Over
a 34 year period, only applied N has provided consistent wheat yield
increases. Grain yield
maximums have been achieved at an average annual N rate of 40 lb N/ac.
However, grain percent N (grain protein) has increased when N was
applied at rates greater than 40 lb N/ac.
In the last ten years, soil test P has approached deficient levels
and yield response to applied P has been significant over this time
period. Yield response due to
applied K has not been observed in this 34 year experiment where soil test
K levels were initially high.
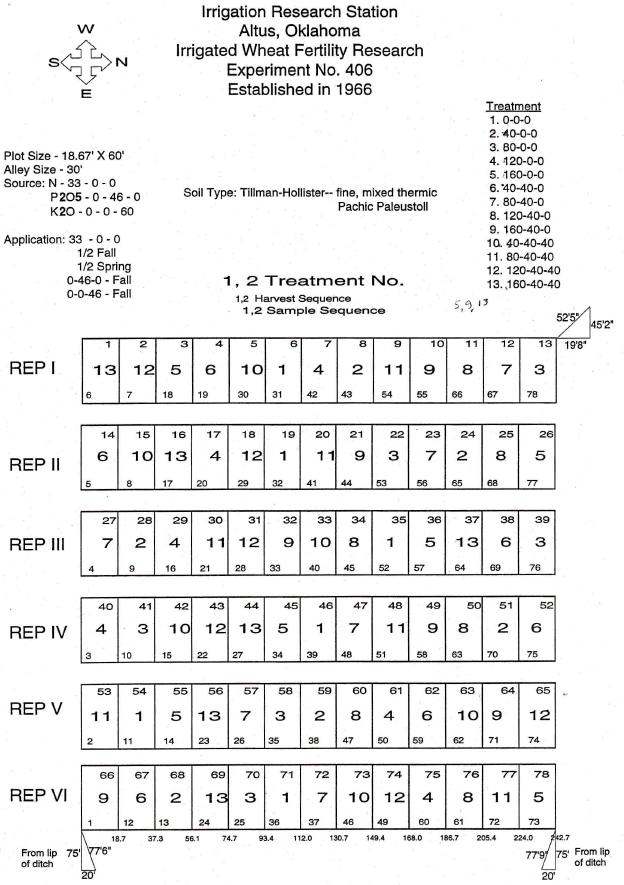
Materials and Methods
In the fall of 1965, Experiment 406 was established under conventional tillage on a Tillman-Hollister clay loam (fine-mixed, thermic Typic Paleustoll) at the Irrigation Research Station near Altus, Oklahoma. Winter Wheat has been planted in 10 inch rows at seeding rates of 90 pounds per acre. In 1969 and 1971, grain yield data was not obtained. In most years, plots were not irrigated in the spring because the economics of the irrigation district have dictated that water is only released for summer crops. When water was applied, it was usually a pre-irrigation prior to planting. The experimental design employed is a randomized complete block with six replications. Management, varieties, and application dates are reported in Table 1. Fertilizer treatments used in this experiment and average grain yields over selected periods are reported in Table 2. Soil test levels from surface samples collected in 1995 are included in Table 3. Individual plots at this site are 15 feet wide and 60 feet long. The center 10 (1966-1995) and 6 (1996-present) feet were harvested with a conventional combine the entire 60 feet in length. In addition to wheat grain yield measured every year, periodic soil and grain samples were taken for further chemical analyses.
Table 1.
Treatment applications and experimental management for continuous
winter wheat Experiment 406, Altus, OK, 1966-2000.
|
Year |
Variety |
Fertilizer |
Planting
Date |
Harvest
Date |
Seeding
Rate |
Irrigation |
Topdress |
|
|
|
Application |
|
|
lb/ac |
Date |
Date |
|
|
|
Date |
|
|
|
|
|
|
1966 |
|
10-1-66 |
|
|
|
|
2-9-67 |
|
1967 |
|
|
|
|
|
|
|
|
1968 |
|
|
|
|
|
|
|
|
1969 |
|
|
|
|
|
4-28-69 |
1-28-69 |
|
1970 |
Tascosa |
10-10-69 |
10-11-69 |
6-6-70 |
90 |
2-17-70 |
2-2-70 |
|
1971* |
Tascosa |
10-14-70 |
10-21-71 |
6-1-71 |
90 |
8-27-70
|
1-25-71 |
|
1972 |
Sturdy |
8-17-71 |
10-9-71 |
6-8-72 |
90 |
None |
2-21-72 |
|
1973 |
TAM
W-101 |
9-11-72 |
10-12-72 |
6-11-73 |
90 |
9-13-72 |
|
|
1974 |
TAM
W-101 |
8-31-73 |
10-26-73 |
6-13-74 |
90 |
None |
2-11-74 |
|
1975 |
TAM
W-101 |
9-5-74 |
9-6-74 |
6-13-75 |
90 |
8-2-74 |
|
|
1976 |
TAM
W-101 |
8-20-75 |
10-9-75 |
6-8-76 |
90 |
9-3-75 |
1-13-76 |
|
1977 |
TAM
W-101 |
8-9-76 |
10-14-76 |
6-9-77 |
80 |
8-11-76 |
2-16-77 |
|
1978 |
TAM
W-101 |
9-14-77 |
10-31-77 |
6-23-78 |
90 |
None |
3-13-78 |
|
1979 |
TAM
W-101 |
8-20-78 |
10-10-78 |
6-20-79 |
90 |
None |
3-13-79 |
|
1980 |
TAM
W-101 |
9-13-79 |
10-18-79 |
6-13-80 |
96 |
None |
3-7-80 |
|
1981 |
TAM
W-101 |
8-22-80 |
11-7-80 |
6-10-81 |
90 |
None |
1-26-81 |
|
1982 |
TAM
W-101 |
9-9-81 |
10-27-81 |
6-30-82 |
90 |
None |
2-23-82 |
|
1983 |
TAM
W-101 |
8-16-82 |
8-16-82 |
6-15-83 |
90 |
None |
3-2-83 |
|
1984 |
TAM
W-101 |
8-25-83 |
11-3-83 |
6-13-84 |
90 |
None |
3-1-84 |
|
1985 |
TAM
W-101 |
8-29-84 |
10-10-84 |
6-20-85 |
90 |
9-7-84 |
3-14-85 |
|
1986 |
TAM
W-101 |
8-23-85 |
11-4-85 |
6-10-86 |
90 |
None |
2-18-86 |
|
1987 |
TAM
W-101 |
9-18-86 |
11-15-86 |
6-8-87 |
90 |
None |
3-6-87 |
|
1988 |
TAM
W-101 |
9-1-87 |
10-6-87 |
6-9-88 |
90 |
9-2-87 |
2-17-88 |
|
1989 |
TAM
W-101 |
10-24-88 |
11-17-88 |
6-22-89 |
90 |
9-1-88 |
All
N preplant |
|
1990 |
TAM
W-101 |
8-10-89 |
9-22-89 |
6-9-90 |
90 |
8-24-89 |
All
N preplant |
|
1991 |
TAM
W-101 |
8-30-90 |
10-10-90 |
6-18-91 |
90 |
None |
All
N preplant |
|
1992 |
TAM-W-101 |
9-22-91 |
9-27-91 |
6-15-92 |
90 |
7-25,8-8-91 |
2-9-92 |
|
1993 |
Karl |
|
10-20-92 |
6-15-93 |
90 |
8-12-92 |
3-25-93 |
|
1994 |
Karl |
8-17-93 |
9-28-93 |
6-3-94 |
90 |
8-20-93 |
3-24-94 |
|
1995 |
Tonkawa |
8-19-94 |
10-27-94 |
6-17-95 |
90 |
8-9-94 |
3-8-95 |
|
1996 |
Tonkawa |
8-17-95 |
10-12-95 |
6-5-96 |
90 |
None |
2-3-96 |
|
1997 |
Tonkawa |
8-15-96 |
10-1-96 |
6-14-97 |
90 |
8-1-96 |
2-3-97 |
|
1998 |
Tonkawa |
9-19-97 |
10-3-97 |
6-4-98 |
90 |
8-12-97 |
3-12-98 |
|
1999 |
Tonkawa |
9-9-98 |
10-12-98 |
6-7-99 |
90 |
7-21,8-14-98 |
1-27-99 |
|
2000 |
Custer |
8-24-99 |
10-8-99 |
5-24-00 |
90 |
8-5-99 |
3-9-00 |
*crop
loss due to drought.
Table
3. Treatment structure and
surface (0-6 inches) soil test analyses from samples collected in the
summer of 1995, Experiment 406, Altus, OK.
|
Trt . |
N |
P2O5 |
K2O |
pH |
Organic C |
Total N |
P |
K |
|
|
|
lb/ac |
|
|
% |
% |
ppm |
ppm |
|
|
|
|
|
|
|
|
|
|
|
1 |
0 |
0 |
0 |
7.29 |
0.84 |
0.073 |
9 |
409 |
|
2 |
40 |
0 |
0 |
7.22 |
0.88 |
0.078 |
9 |
414 |
|
3 |
80 |
0 |
0 |
7.39 |
0.90 |
0.079 |
7 |
403 |
|
4 |
120 |
0 |
0 |
7.97 |
0.90 |
0.082 |
8 |
421 |
|
5 |
160 |
0 |
0 |
7.39 |
0.90 |
0.086 |
9 |
415 |
|
6 |
40 |
40 |
0 |
7.42 |
0.87 |
0.080 |
31 |
418 |
|
7 |
80 |
40 |
0 |
7.35 |
0.93 |
0.083 |
26 |
410 |
|
8 |
120 |
40 |
0 |
7.30 |
1.00 |
0.089 |
27 |
408 |
|
9 |
160 |
40 |
0 |
7.20 |
0.96 |
0.088 |
27 |
407 |
|
10 |
40 |
40 |
40 |
7.12 |
0.87 |
0.076 |
32 |
444 |
|
11 |
80 |
40 |
40 |
7.38 |
0.93 |
0.082 |
25 |
432 |
|
12 |
120 |
40 |
40 |
7.12 |
0.95 |
0.085 |
24 |
445 |
|
13 |
160 |
40 |
40 |
6.79 |
0.93 |
0.083 |
24 |
441 |
|
|
|
|
|
|
|
|
|
|
|
SED |
|
|
0.18 |
0.03 |
0.004 |
2.3 |
14 |
|
|
CV, % |
|
|
4 |
6 |
9 |
20 |
5 |
|
N,
P and K applied as 34-0-0, 0-46-0 and 0-0-60 respectively.
N applied 1/2 fall, 1/2 spring.
SED - standard error of the difference between two equally replicated
means, CV - coefficient of variation.
Table
2. Treatment structure of a
long-term supplemental irrigation winter wheat Experiment 406 and
overall means, Altus, OK, 1966-2000.
|
Trt. |
N |
P2O5 |
K2O |
1966-1970 |
1972-1980 |
1981-1990 |
1991-2000 |
1966-2000 |
|||||
|
|
|
lb/ac |
|
bu/ac |
%N |
bu/ac |
%N |
bu/ac |
%N |
bu/ac |
%N |
bu/ac |
%N |
|
|
|
|
|
|
|
|
|
|
|
|
|
|
|
|
1 |
0 |
0 |
0 |
14.1 |
2.47 |
23.1 |
2.37 |
21.3 |
2.04 |
13.5 |
2.53 |
18.6 |
2.35 |
|
2 |
40 |
0 |
0 |
19.8 |
2.57 |
31.5 |
2.65 |
27.4 |
2.40 |
20.5 |
2.68 |
25.5 |
2.57 |
|
3 |
80 |
0 |
0 |
18.8 |
2.82 |
32.1 |
2.83 |
27.6 |
2.53 |
21.9 |
2.95 |
26.0 |
2.77 |
|
4 |
120 |
0 |
0 |
18.6 |
2.95 |
33.7 |
2.91 |
26.7 |
2.64 |
22.2 |
3.02 |
26.3 |
2.88 |
|
5 |
160 |
0 |
0 |
17.5 |
2.97 |
32.9 |
3.07 |
27.3 |
2.58 |
23.0 |
3.08 |
26.3 |
2.92 |
|
6 |
40 |
40 |
0 |
22.3 |
2.54 |
33.4 |
2.63 |
29.6 |
2.10 |
21.6 |
2.58 |
27.3 |
2.46 |
|
7 |
80 |
40 |
0 |
18.6 |
2.91 |
34.6 |
2.83 |
28.9 |
2.63 |
25.2 |
2.93 |
28.1 |
2.82 |
|
8 |
120 |
40 |
0 |
17.6 |
2.96 |
34.8 |
2.90 |
29.1 |
2.68 |
27.7 |
3.06 |
28.9 |
2.90 |
|
9 |
160 |
40 |
0 |
16.6 |
3.19 |
31.9 |
2.97 |
28.7 |
2.92 |
26.0 |
3.11 |
27.3 |
3.05 |
|
10 |
40 |
40 |
40 |
20.9 |
2.64 |
32.7 |
2.48 |
29.3 |
2.16 |
21.5 |
2.61 |
26.9 |
2.47 |
|
11 |
80 |
40 |
40 |
19.5 |
2.82 |
35.4 |
2.78 |
29.8 |
2.59 |
24.7 |
2.91 |
28.5 |
2.77 |
|
12 |
120 |
40 |
40 |
15.9 |
2.88 |
32.1 |
2.96 |
28.3 |
2.76 |
26.0 |
3.10 |
27.1 |
2.91 |
|
13 |
160 |
40 |
40 |
15.0 |
3.00 |
31.6 |
3.04 |
27.3 |
2.74 |
24.8 |
3.08 |
26.2 |
2.96 |
|
|
|
|
|
|
|
|
|
|
|
|
|
|
|
|
SED |
|
|
|
2.37 |
0.23 |
3.24 |
0.19 |
3.24 |
0.21 |
2.47 |
0.11 |
2.9 |
0.20 |
|
CV,
% |
|
|
|
18 |
12 |
14 |
10 |
17 |
12 |
15 |
5 |
16 |
10 |
N,
P and K applied as 34-0-0, 0-46-0 and 0-0-60 respectively.
N applied 1/2 fall, 1/2 spring
1971-crop loss due to drought.