Abstract
Winter wheat grain yield
response to fertilization with nitrogen (N), phosphorus (P) and
potassium (K) in long-term experiments continues to be relevant in terms
of sustainability and environmental risk.
Experiment 407 was established in 1966 and has now been conducted
for 34 years. Response to
applied N, P, and K has been limited at this site, largely due to high
soil test nutrient levels and low yields over the extensive number of
years evaluated. From
1966 to 1980, only limited increases in grain yield due to applied N
were observed. Since 1980,
grain yields have increased significantly due to applied N, generally
being maximized at the 40 lb N/ac/yr rate.
Yield increases due to applied N in this dryland winter wheat
experiment have ranged from 5 to 10 bu/ac.
Grain %N levels have been found to increase linearly up to 80 lb
N/ac/yr (beyond the N rate required for maximum yields).
As grain protein premiums become increasingly more important,
optimum N rates for grain %N will need to be refined.
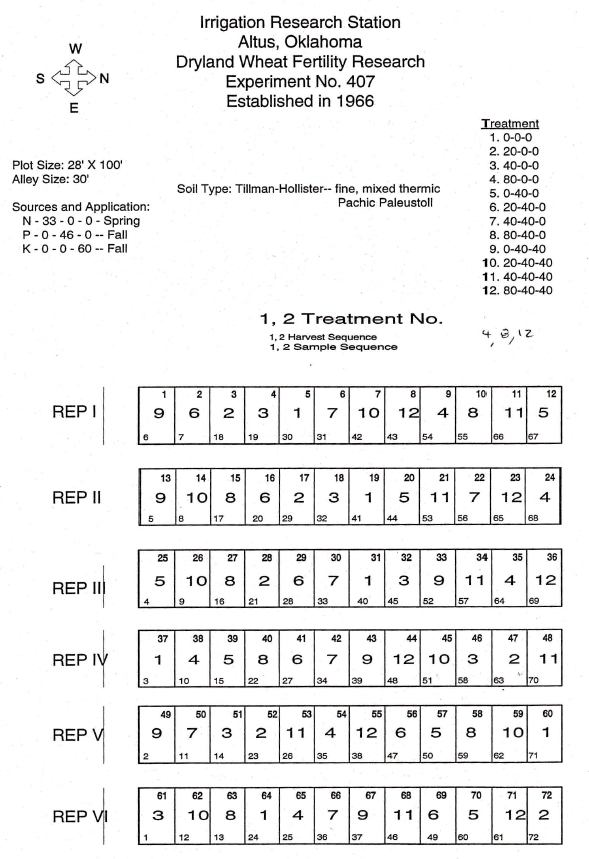
Materials and Methods
In the fall of 1965,
Experiment 407 was established under conventional tillage on a
Tillman-Hollister clay loam (fine-mixed, thermic Typic Paleustoll) at
the Irrigation Research Station near Altus, Oklahoma.
Winter Wheat has been planted for 31 continuous years in 10 inch
rows at seeding rates of 60 pounds per acre.
Grain yield data for the 1971 crop year was lost due to drought.
The experimental design employed is a randomized complete block
with six replications. Variety changes and associated fertilizer
application, planting and harvest dates are included in Table 1.
Fertilizer treatments used in this experiment and grain yield
averages from selected periods are reported in Table 2. Individual plots
at this site are 15 feet wide and 60 feet long.
The center 10 feet were harvested with a conventional combine the
entire 60 feet in length. In
addition to wheat grain yield measured every year, periodic soil and
grain samples were taken for further chemical analyses.
Soil test results from surface samples collected in the summer of
1995 are included in Table 3.
Table 1. Treatment applications, and experimental management for continuous winter wheat Experiment 407, Altus, OK, 1966-2000.
|
Year |
Variety |
Fertilizer |
Planting
Date |
Harvest
Date |
Seeding
Rate |
Topdress
Date |
|
1966 |
|
|
|
|
|
|
|
1967 |
|
|
|
|
|
|
|
1968 |
|
|
|
|
|
|
|
1969 |
|
|
|
6-3-69 |
|
|
|
1970 |
KAW
61 |
10-9-69 |
10-11-69 |
6-5-70 |
40 |
|
|
1971 |
KAW
61 |
10-14-70 |
10-20-70 |
6-1-71 |
60 |
1-26-71 |
|
1972 |
Danne |
8-17-71 |
10-5-71 |
6-8-72 |
40 |
2-23-72 |
|
1973 |
Nicoma |
9-5-72 |
10-4-72 |
6-6-73 |
40 |
|
|
1974 |
Nicoma |
9-21-73 |
10-24-73 |
6-13-74 |
50 |
2-11-74 |
|
1975 |
Nicoma |
10-9-74 |
10-11-74 |
6-12-75 |
40 |
|
|
1976 |
Triumph
64 |
8-14-75 |
10-7-75 |
6-10-76 |
60 |
1-13-76 |
|
1977 |
Triumph
64 |
8-10-76 |
10-14-76 |
6-8-77 |
60 |
2-17-77 |
|
1978 |
Triumph
64 |
9-14-77 |
11-7-77 |
6-22-78 |
60 |
3-14-78 |
|
1979 |
Triumph
64 |
8-20-78 |
10-9-78 |
6-20-79 |
60 |
3-12-79 |
|
1980 |
Triumph
64 |
9-12-79 |
10-18-79 |
6-19-80 |
60 |
3-10-80 |
|
1981 |
TAM
W-101 |
8-20-80 |
11-7-80 |
6-10-81 |
60 |
1-26-81 |
|
1982 |
TAM
W-101 |
9-8-81 |
10-27-81 |
6-30-82 |
60 |
2-23-82 |
|
1983 |
TAM
W-101 |
8-18-82 |
10-28-82 |
6-16-83 |
60 |
3-4-83 |
|
1984 |
TAM
W-101 |
8-25-83 |
12-5-83* |
6-12-84 |
60 |
3-2-84 |
|
1985 |
TAM
W-101 |
8-29-84 |
10-10-84 |
6-20-85 |
90 |
3-5-85 |
|
1986 |
TAM
W-101 |
8-23-85 |
11-5-85 |
6-2-86 |
60 |
2-19-86 |
|
1987 |
TAM
W-101 |
9-16-86 |
11-15-86 |
6-23-87 |
60 |
3-5-87 |
|
1988 |
TAM
W-101 |
9-4-87 |
10-6-87 |
6-10-88 |
60 |
2-18-88 |
|
1989 |
TAM
W-101 |
10-26-88 |
11-17-88 |
6-22-89 |
60 |
3-9-89 |
|
1990 |
TAM
W-101 |
8-10-89 |
9-22-89 |
6-8-90 |
60 |
3-9-90 |
|
1991 |
TAM
W-101 |
8-30-90 |
9-27-90 |
6-19-91 |
60 |
2-7-91 |
|
1992 |
TAM
W-101 |
9-22-91 |
9-27-91 |
6-16-92 |
60 |
2-9-92 |
|
1993 |
Karl |
|
10-20-92 |
6-16-93 |
60 |
3-25-93 |
|
1994 |
Karl |
8-17-93 |
9-28-93 |
6-3-94 |
60 |
3-24-94 |
|
1995 |
Tonkawa |
8-19-94 |
10-27-94 |
6-17-95 |
60 |
3-8-95 |
|
1996 |
Tonkawa |
8-18-95 |
10-11-95 |
6-6-96 |
60 |
2-3-96 |
|
1997 |
Tonkawa |
8-15-96 |
10-1-96 |
6-14-97 |
60 |
2-3-97 |
|
1998 |
Tonkawa |
9-19-97 |
10-3-97 |
6-4-98 |
60 |
3-12-98 |
|
1999 |
Tonkawa |
9-9-98 |
10-12-98 |
6-7-99 |
60 |
1-27-99 |
|
2000 |
Custer |
8-24-99 |
10-8-99 |
5-24-00 |
60 |
3-9-00 |
N, P and K applied as
34-0-0, 0-46-0 and 0-0-60 respectively.
All N applied in the spring.
P and K applied preplant and incorporated.
SED - standard error of the difference between two equally
replicated means, CV - coefficient of variation.
Table 2.
Treatment structure of a long-term supplemental irrigation winter
wheat Experiment 407 and overall means, Altus, OK, 1966-2000
|
Trt
. |
N |
P2O5 |
K2O |
1966-1970 |
|
1973-1980 |
1981-1990 |
1991-2000 |
1966-2000 |
||||
|
|
|
lb/ac |
|
bu/ac |
%N |
bu/ac |
%N |
bu/ac |
%N |
bu/ac |
%N |
bu/ac |
%N |
|
1 |
0 |
0 |
0 |
19.2 |
2.88 |
24.2 |
2.32 |
21.3 |
2.08 |
15.0 |
2.37 |
19.8 |
2.42 |
|
2 |
20 |
0 |
0 |
18.4 |
2.90 |
25.9 |
2.63 |
23.9 |
2.41 |
19.3 |
2.60 |
22.2 |
2.64 |
|
3 |
40 |
0 |
0 |
17.4 |
2.96 |
26.2 |
2.58 |
24.3 |
2.54 |
20.4 |
2.83 |
22.5 |
2.72 |
|
4 |
80 |
0 |
0 |
18.3 |
2.97 |
27.7 |
2.76 |
25.3 |
2.60 |
22.3 |
3.00 |
23.9 |
2.83 |
|
5 |
0 |
40 |
0 |
22.1 |
2.74 |
25.1 |
2.11 |
22.7 |
1.86 |
15.2 |
2.41 |
20.9 |
2.28 |
|
6 |
20 |
40 |
0 |
19.9 |
2.94 |
27.1 |
2.46 |
28.2 |
2.10 |
20.5 |
2.46 |
24.3 |
2.49 |
|
7 |
40 |
40 |
0 |
16.8 |
3.00 |
30.2 |
2.72 |
29.4 |
2.40 |
22.7 |
2.71 |
25.6 |
2.71 |
|
8 |
80 |
40 |
0 |
15.9 |
2.98 |
26.5 |
2.74 |
27.6 |
2.77 |
25.1 |
3.02 |
24.8 |
2.88 |
|
9 |
0 |
40 |
40 |
21.9 |
2.71 |
24.3 |
2.10 |
22.5 |
2.15 |
15.5 |
2.36 |
20.7 |
2.33 |
|
10 |
20 |
40 |
40 |
21.4 |
3.01 |
28.6 |
2.52 |
29.6 |
2.06 |
19.9 |
2.49 |
25.2 |
2.52 |
|
11 |
40 |
40 |
40 |
17.9 |
2.93 |
30.4 |
2.76 |
29.5 |
2.44 |
23.4 |
2.66 |
26.1 |
2.70 |
|
12 |
80 |
40 |
40 |
15.9 |
2.93 |
28.1 |
2.85 |
28.1 |
2.69 |
24.4 |
2.91 |
25.2 |
2.84 |
|
|
|
|
|
|
|
|
|
|
|
|
|
|
|
|
SED |
|
|
|
1.5 |
0.13 |
2.4 |
0.18 |
2.22 |
0.34 |
2.44 |
0.11 |
2.29 |
0.21 |
|
CV,
% |
|
|
|
11 |
6 |
13 |
10 |
12 |
20 |
17 |
6 |
14 |
11 |
N,
P and K applied as 34-0-0, 0-46-0 and 0-0-60 respectively. 1971-1972-crop
loss due to drought.
Table 3. Treatment structure and surface (0-6 inches) soil test analyses from samples collected in the summer of 1995, Experiment 407, Altus, OK, 1966-1997.
|
Trt . |
N |
P2O5 |
K2O |
pH |
Organic C |
Total N |
P |
K |
|
|
|
lb/ac |
|
|
% |
% |
ppm |
ppm |
|
|
|
|
|
|
|
|
|
|
|
1 |
0 |
0 |
0 |
6.8 |
0.929 |
0.079 |
7.4 |
502 |
|
2 |
20 |
0 |
0 |
6.8 |
0.989 |
0.094 |
8.4 |
480 |
|
3 |
40 |
0 |
0 |
6.8 |
0.982 |
0.084 |
9.2 |
546 |
|
4 |
80 |
0 |
0 |
6.5 |
1.038 |
0.091 |
9.2 |
528 |
|
5 |
0 |
40 |
0 |
6.8 |
0.948 |
0.084 |
42.2 |
496 |
|
6 |
20 |
40 |
0 |
6.7 |
0.950 |
0.082 |
36.6 |
525 |
|
7 |
40 |
40 |
0 |
6.7 |
1.045 |
0.092 |
34.1 |
530 |
|
8 |
80 |
40 |
0 |
6.4 |
1.087 |
0.104 |
33.5 |
516 |
|
9 |
0 |
40 |
40 |
6.9 |
0.931 |
0.081 |
45.8 |
590 |
|
10 |
20 |
40 |
40 |
6.8 |
1.006 |
0.085 |
37.3 |
570 |
|
11 |
40 |
40 |
40 |
6.6 |
1.024 |
0.087 |
33.0 |
583 |
|
12 |
80 |
40 |
40 |
6.4 |
1.076 |
0.095 |
32.5 |
564 |
|
|
|
|
|
|
|
|
|
|
|
SED |
|
|
|
0.12 |
0.12 |
0.004 |
3.5 |
84 |
|
CV |
|
|
|
3 |
10 |
8 |
22 |
7 |
N,
P and K applied as 34-0-0, 0-46-0 and 0-0-60 respectively.
All N applied in the spring. P
and K applied preplant and incorporated. SED
- standard error of the difference between two equally
replicated means, CV - coefficient of variation.