|
1Department of Plant and Soil Sciences,
2Department of Biosystems and Agricultural Engineering, Oklahoma State
University, Stillwater, Ok 74078. Contribution from the Oklahoma Agricultural
Experiment Station. *Corresponding author.
ABSTRACT
Current methods of determining nitrogen (N)
fertilization rates in winter wheat (Triticum aestivum L.) are based on farmer
projected yield goals and fixed N removal rates per unit of grain produced. This
work reports on an alternative method of determining fertilizer N rates using
estimates of early-season plant N uptake and potential yield determined from
in-season spectral measurements collected between January and April. Reflectance
measurements under daytime lighting in the red and near infrared regions of the
spectra were used to compute the normalized difference vegetation index (NDVI).
Using a modified daytime lighting reflectance sensor, early-season plant N
uptake between Feekes physiological growth stages 4 (leaf sheaths lengthen)
through 6 (first node of stem visible) was found to be highly correlated with
NDVI. Further analyses showed that dividing the NDVI sensor measurements between
Feekes growth stages 4 and 6, by the days from planting to sensing date was
highly correlated with final grain yield. This in-season estimate of yield (INSEY)
was subsequently used to compute the potential N that could be removed in the
grain. In-season N fertilization needs were then considered to be equal to the
amount of predicted grain N uptake (potential yield times grain N) minus
predicted early-season plant N uptake (at the time of sensing), divided by an
efficiency factor of 0.70. This method of determining in-season fertilizer need
has been shown to decrease large area N rates while also increasing wheat grain
yields when each 1m2 area was sensed and treated independently.
INTRODUCTION
The word precision, is defined as 'the quality or state of
being precise, or exactness.' In many ways, precision agriculture is still being
defined, but it certainly must include 'being precise, or exact' in the
management of agronomic and engineering variables. The development of a
precision agriculture technology (PAT) would imply that it resulted in a more
precise measurement and treatment of the independent variables than had been
achieved before. In this regard, the scientific community has the responsibility
of making sure that each new PAT result in a measurable improvement
(application, management, monitoring, and/or mapping). The measurable
improvement could be decreased inputs with no sacrifice in yield, or increased
yield at the same level of inputs (improved efficiency) for the specific
variable being evaluated. One of the more radical hypotheses was recently posed
by Solie et al. (1999) who contended that the area over which variable rate
fertilizer applicators should sense and apply materials is likely to be 1.0 by
1.0 m or smaller. Taking this a step further suggests that each PAT applied to
field crop production must be evaluated at a resolution less than or equal to
1.0m2. This challenge has been recognized since various research programs have
already noted that spatially variable N fertilizer application may reduce
adverse environmental impacts and increase economic return (Fiez et al., 1995)
Filella et al. (1995) noted that remote sensing could provide
inexpensive, large-area estimates of N status and be used to monitor N status,
since leaf chlorophyll A content is mainly determined by N availability. They
further reported that the use of reflectance at 430 nm, 550 nm, 680 nm, and red
edge wavelengths offers potential for assessing N status of wheat. Work with
winter wheat by Raun et al. (2000) found that two post-dormancy NDVI
measurements (reflectance of red and near infrared in January and March) divided
by the cumulative growing degree days from the first to the second reading could
be used to predict potential grain yield. They also indicated that if potential
grain yield could be predicted in-season, topdress N rates could be based on
predicted yield.
Sowers et al. (1994) reported that reduced N rates and split
N applications between fall and spring can maintain high yields but at reduced
grain protein levels. It is therefore conceivable, that if variable rate
technology resulted in applied N based on projected need or potential yield
(some areas receive added N, some do not), average grain protein levels may not
decrease in fields where N was applied using variable rate technology.
An area where PAT's will likely be beneficial is in the
identification of sustainable production practices and management tools.
Halvorson et al. (1999) recently reported that increases in soil organic carbon,
improved soil quality and productivity with increased N fertilization.
Capitalizing on the spatial variability known to exist in agricultural fields
reported by Solie et al. (1999), precision applied N could increase C
sequestration (on average) when compared to flat rates.
On a global scale, Tilman (1999) reported that the doubling
of agricultural food production during the past 34 years was associated with a
6.87-fold increase in N fertilization, 3.48-fold increase in P fertilization,
1.68-fold increase in the amount of irrigated cropland and a 1.1-fold increase
in land in cultivation. This work further noted that the next doubling of global
food production would be associated with a 3-fold increase in N and P
fertilization rates, doubling of the irrigated land area, and an 18% increase in
cropland. Therefore, it seems plausible that PAT's could fill a large forecasted
void regarding world food production and the need for sustainable agricultural
systems.
The objectives of this work were (i) to determine the
feasibility of using a single optical sensor measurements to predict
early-season plant N uptake for readings obtained over locations, stages and
years, (ii) to determine the best method to empirically calibrate optical sensor
measurements with potential wheat grain yield when readings are made at
different growth stages, geographical locations and in different years, and
(iii) propose a procedure to use optically sensed estimates of early season
plant N uptake and potential yield to calculate N fertilizer application rate.
MATERIALS AND METHODS
During the winter months of 1998, 1999 and 2000, spectral
reflectance readings were taken from 9 winter wheat experiments to refine
estimates of early-season plant N uptake at or near Feekes growth stage 5 and
from 16 experiments to refine estimates of potential grain yield. Each
experiment was either an on-going long-term experiment (numbers assigned in the
1960's and 1970's as 222, 301, 502 and 801), a short-term (1-3 years) field
experiment that included the evaluation of preplant N rates, or transects (50,
1x1m continuous plots). The early-season plant N uptake and potential yield
experiments are further defined in Tables 1 and 2, respectively. The soils at
each of these locations are; Perkins, Teller sandy loam (fine-loamy, mixed,
thermic Udic Argiustolls); Tipton, Tipton silt loam (fine-loamy, mixed, thermic
Pachic Argiustolls); Stillwater, Kirkland silt loam (fine, mixed, thermic
Udertic Paleustolls); Efaw, Norge silt loam (fine-silty, mixed, thermic Udic
Paleustolls); Lahoma, Grant silt loam (fine-silty, mixed, thermic Udic
Argiustolls); and Haskell, Taloka silt loam (fine, mixed, thermic Mollic
Albaqualfs). The row spacing by N rate (S*N), Efaw anhydrous ammonia (AA), and
transect experiments were each one-year trials. The N rate by P rate (N*P)
experiment at Perkins was initiated in 1996. Experiments 222, 301 and 502 were
initiated in 1969, 1993 and 1971, respectively, and all three evaluated annual
rates of applied N at constant levels of P and K (Table 1). Winter wheat was
planted at a 78 kg ha-1 seeding rate using a 0.19 m row spacing, excluding the
S*N experiment at Perkins (spacing ranged from 0.15 to 0.30 m). Varieties used
in each trial are reported in Tables 1 and 2.
Spectral reflectance was measured using an Oklahoma State
University designed instrument that included two upward directed photodiode
sensors, and that received incident light through cosine corrected Teflon®
windows fitted with red (671±6nm) and near-infrared (NIR)(780±6nm)
interference filters. The instrument also included two down-looking photodiode
sensors that received light through collination and interference filters
identical to the up-looking sensors. The instrument used a 16 bit A/D converter
to simultaneously capture and convert the signals from the four photodiode
sensors. Collination was used to constrain the view of the down-looking sensors
to a 0.84 m2 oblong area at the plant surface. Stability of the sensor was
maintained across time by calibration with a barium sulfate coated aluminum
plate. The reflectance of the barium sulfate coated plate was assumed to be 1.0
for both spectral bands investigated. Reflectance values (the ratio of incident
and reflected values) were used in the NDVI calculation to minimize the error
associated with cloud cover, shadows and sun angle. Reflectance based NDVI was
calculated using the following equation: NDVI = [(NIRref/NIRinc)-(Redref/Redinc)]
/ [(NIRref/NIRinc)+(Redref/Redinc)], where NIRref and Redref = magnitude of
reflected light, and NIRinc and Redinc = magnitude of the incident light.
Although 4 different wheat varieties are included in this
work, varietal differences were not targeted, since findings of Sembiring et al.
(2000) showed limited differences in post-dormancy NDVI readings for common
wheat varieties grown in this region. Reflectance readings from all experiments
were collected at two post-dormancy dates. The two dates (Time-1 and Time-2,
respectively) where readings were collected ranged between Feekes growth stage 4
(leaf sheaths beginning to lengthen), 5 (pseudo-stem, formed by sheaths of
leaves strongly erect), and 6 (first node of stem visible)(Large, 1954). For the
early-season plant N uptake and grain yield potential experiments, individual
wheat plot reflectance readings were taken from 1.0 m2 and 4.0m2 areas,
respectively, between 10 a.m. and 4 p.m under natural lighting. For the
early-season plant N uptake experiments (Table 1), individual 1m2 plots were
hand clipped (immediately following sensor readings) and weighed prior to being
dried in a forced air oven at 60°C. Once dry, samples were ground to pass a
0.125mm (120-mesh) sieve and analyzed for total N using a Carlo Erba (Milan,
Italy) NA-1500 dry combustion analyzer (Schepers et al., 1989). Early-season
plant N uptake was determined by multiplying dry matter yield by the total N
concentration determined from dry combustion.
In the grain potential yield trials, grain yield was
determined using a self propelled combine from the same 4.0 m2 area where
spectral reflectance data were collected. We assumed that growth from planting
in October to the mid winter months of January and February would provide an
excellent indicator of wheat health in each 4.0 m2 area and the influence of
early-season growth-limiting conditions for small areas. In-season estimated
yield, or INSEY, was determined by dividing NDVI sensor measurements between
Feekes growth stages 4 and 6 by the days from planting to the date sensor
measurements were taken. A number of possible indices relating NDVI to wheat
yield were investigated. Indices were ranked by regression (R2) and the index
with the highest R2 for all dates was selected for estimating potential grain
yield. Because NDVI at Feekes 4-6 has been shown to be an excellent predictor of
early-season plant N uptake, the INSEY value reported here represents plant N
uptake per day. The use of days from planting to sensing in the computation of
INSEY allowed us to predict the early-season plant N uptake per day from sites
where planting to sensing ranged from 123 to 167 days (Table 2).
Following initial indices of estimated yield (EY) reported by
Raun et al. (2000), the INSEY index reported here was one of many indices
evaluated that included mathematical combinations of NDVI at various growth
stages, days from planting to sensing times, growing degree days (GDD) from
planting to sensing, and days, and GDD between sensor readings (GDD = [(Tmin +
Tmax)/2 - 4.4°C] (Tmin and Tmax recorded from daily data).
Measured grain yield was considered to be the best available
measure of potential grain yield, especially where limited stress occurred after
sensor readings in late February and early March. Linear, quadratic, logarithmic
and exponential models were evaluated that included all locations and data
subsets using various indices to predict grain yield.
RESULTS
The relationship between early-season plant N uptake and NDVI
for the nine experiments where forage biomass, forage N and sensor readings were
collected between Feekes growth stages 4 and 6, is reported in Figure 1. NDVI
was an excellent predictor of early-season plant N uptake for these nine trials
that covered three years, two varieties, a range of planting and sensing dates,
and three physiological stages of growth. Earlier work by Sembiring et al.
(2000) reported high correlation between early-season plant N uptake and NDVI
between Feekes growth stages 4 and 8. However, they reported that specific
by-stage early-season plant N uptake calibration would be needed when using NDVI
as a predictor, since the linear regression equations differed significantly by
stage. To some extent this was expected since the NDVI readings used in their
work (earlier version of the sensor employed in this work) were not calibrated
to account for changing light (sun angle, clouds, shadows) when recording sensor
readings from one time (day, month, location) to the next. Using the reflectance
based NDVI equation and the improved sensor which measured both incident and
reflected radiance, early-season plant N uptake could now be reliably predicted
(R2=0.75) over stage of growth (Figure 1). It is important to note that an
average of 45 kg N ha-1 was taken up in the forage for all nine experiments
(Figure 1) and that this represents over half of the total N that would end up
in the grain (average yield of 2.52 Mg ha-1 would have 63 kg N ha-1 removed in
the grain when grain N % = 2.5, Thomason et al., 2000). Therefore, a large
portion of the potential-yield-N is assimilated by early to mid-February, which
is four months before harvest.
In addition to being a reliable predictor of early-season
plant N uptake between Feekes growth stages 4 and 6, NDVI readings taken at
these same stages were positively correlated with final grain yield (Figure 2).
Although these results were encouraging, data from several locations over this
three-year period clearly did not fit the general trend (Figure 2). Earlier work
by Raun et al. (2000) noted that the sum of NDVI readings at Feekes 4 and Feekes
5, divided by the cumulative GDD between readings was a reliable predictor of
wheat grain yield at 6 of 9 locations. Their work was considered to be somewhat
cumbersome since it relied on two post-dormancy sensor readings to predict wheat
grain yield. Further analyses of these same 9 trials, plus 7 more locations
(total of 16) showed that NDVI divided by the total number of days from planting
to sensing was better correlated (R2 of 0.64 compared to R2 of 0.53) with wheat
grain yield. More importantly, this in-season estimate of yield (INSEY) included
all sixteen sites over a three-year period, and that was clearly an improvement
upon the EY equation initially reported by Raun et al. (2000).
Dividing NDVI at Feekes 5 (excellent predictor of
early-season plant N uptake, Figure 1) by the days from planting to the NDVI
sensing date resulted in an index that would approximate N uptake per day. This
estimate of N uptake per day could be viewed as the rate at which N was
accumulated from October to March. Equally important for this compiled data was
knowing that the days from planting to sensing (INSEY divisor) ranged from 123
to 167 days. Even if the range in inclement mid-winter weather varied by 10 to
30 days (from one site to the next), the total number of days for potential
growth would be a plausible divisor for the in-season NDVI measurement. It
should be noted that almost all of the measurements were made after winter wheat
had broken dormancy, thus exhibiting more rapid growth. Considering that three
years of data, sixteen site-years, and differing planting and sensing dates were
included in this work, the new INSEY index clearly provided a common linkage for
a holistic model (Figure 3). This was also evident when plotting wheat grain
yield as a function of INSEY for each of the years where data was recorded,
using exponential models (Figure 4). Only limited differences were observed
between models for 1998 (3 sites), 1999 (6 sites) and 2000 (7 sites).
We also found that the use of growing degree days from
planting in the divisor did not provide significant improvement when predicting
yield compared to the use of NDVI alone. Work by Raun et al. (2000) successfully
used growing degree days from the first sensing to the second sensing, but their
index (EY) was bound by needing two sensor readings. Similar to results reported
here, they reported that the use of growing degree days from planting to the
first or second sensor reading did not improve the prediction of wheat grain
yield.
DISCUSSION
The central component behind our nitrogen fertilization
optimization algorithm (NFOA) is the ability to predict potential grain yield
in-season, and early enough to apply fertilizer N based on predicted need.
Equally important is the ability to identify the need for fertilizer N in such a
way that added N will correct for projected need.
Because we are able to predict percent N in the grain (based
on a relationship with predicted yield level), early-season plant N uptake (NDVI
readings at Feekes 4 to 6) and wheat grain yield (INSEY), we propose the
following procedures to determine N fertilizer application rate:
1. Predict potential grain yield (PGY) from the
Grain yield-INSEY equation
PGY in (Mg ha-1) = 0.74076 + 0.10210 e577.66INSEY
2. Predict percent N in the grain based on predicted grain yield (Figure 5,
total N determined on 688 samples where grain yield was recorded, 1980 to
1999)
Percent N in the grain = 0.0703PGY2 - 0.5298PGY + 3.106
3. Calculate predicted grain N uptake (predicted percent N in the grain
multiplied by predicted grain yield)
4. Calculate predicted early-season plant N uptake from NDVI
Early-season plant N uptake (kg ha-1) = 14.76 + 0.7758 e5.468NDVI
5. Determine in-season topdress fertilizer N requirement = (predicted grain N
uptake - predicted early-season plant N uptake)/0.70
In our method, the predicted N
deficit is the difference in predicted total grain N uptake minus the predicted
early-season plant N uptake. Dividing the predicted N deficit (actual plant N
need for added N) by 0.70 in step 5 basically says that we can achieve a maximum
of 70% use efficiency for mid-winter applied N in winter wheat. In some regions,
this should theoretically be much less where the potential for immobilization,
denitrification, and/or volatilization are greater. Wuest and Cassman (1992)
reported that recovery of applied N at planting ranged from 30 to 55% while that
applied at flowering ranged from 55 to 80%. Raun and Johnson (1999) recently
reported that worldwide nitrogen use efficiency for cereal production is
approximately 33%. In this regard, the divisor could realistically range between
0.33 and 0.80.
This procedure is different from that used by other
researchers and practitioners. The proposed procedure prescribes increased N
rates in areas of the field with high yield potential as indicated by INSEY and
reduced N fertilizer in areas of the field with lower yield potential. In
addition, this procedure accounts for the amount of N in the wheat plant (at the
time of sensing) and adjusts for need accordingly.
Field application of the process will be to compile planting
date information prior to sensing, whereby NDVI readings can be collected from
each 1m2, divided by the number of days from planting and a prescribed
fertilizer rate applied on-the-go. Nitrogen application rates will be calculated
using the previously outlined procedure, whereby the fertilizer application rate
needed to optimize yield at that location will be set by the predicted yield
potential. If a producer chooses to lower predicted yield potential, rates could
be adjusted upward or downward, based on that input.
The use of INSEY and the Nitrogen Fertilizer Optimization Algorithm could
replace N fertilization rates determined using production history (yield goals),
provided that the production system allows for in-season application of
fertilizer N. Application of this procedure should result in increased grain
yields at lower N rates when INSEY is computed and applied to each 1m2. This
procedure should also increase N use efficiency (decreased N applied where
early-season plant N uptake was already high) when the production system allows
for in-season application of fertilizer N.
References
Fiez, T.E., W.L. Pan, and B.C. Miller. 1995.
Nitrogen use efficiency of winter wheat among landscape positions. Soil Sci.
Soc. Amer. J. 59:1666-1671.
Filella, I., L. Serrano, J. Serra and J. Penuelas.
1995. Evaluating wheat nitrogen status with canopy reflectance indices and
discriminant analysis. Crop Sci. 35:1400-1405.
Halvorson, A.D., C.A. Reule, and R.F. Follett.
1999. Nitrogen fertilization effects on soil carbon and nitrogen in a dryland
cropping system. Soil Sci. Soc. Amer. J. 63:912-917.
Raun, W.R., and G.V. Johnson. 1999. Improving
nitrogen use efficiency for cereal production. Agron. J. 91:357-363.
Raun, W.R., J.B. Solie, G.V. Johnson, M.L. Stone,
E.V. Lukina, W.E. Thomason, and J.S. Schepers. 2000. In-season prediction of
potential grain yield in winter wheat using canopy reflectance. Agron. J. (in
press).
Schepers, J.S., D.D. Francis, and M.T. Thompson.
1989. Simultaneous determination of total C, total N and 15N on soil and plant
material. Commun. Soil Sci. Plant Anal. 20:949-959.
Sembiring, H., H.L. Lees, W.R. Raun, G.V.
Johnson, J.B. Solie, M.L. Stone, M.J. DeLeon, E.V. Lukina, D.A. Cossey, J.M.
LaRuffa, C.W. Woolfolk, S.B. Phillips, and W.E. Thomason, . 2000. Effect of
growth stage and variety on spectral radiance in winter wheat. J. Plant Nutr.
23:141-149.
Solie, J.B., W.R. Raun and M.L. Stone. 1999.
Submeter spatial variability of selected soil and bermudagrass production
variables. Soil Sci. Soc. Am. J. 63:1724-1733.
Sowers, K.E., B.C. Miller and W.L. Pan. 1994.
Optimizing yield and grain protein in soft white winter wheat with split
nitrogen applications. Agron. J. 86:1020-1025.
Thomason, W.E., W.R. Raun and G.V. Johnson. 2000.
Winter wheat fertilizer nitrogen use efficiency in grain and forage production
systems. J. Plant Nutr. (in press).
Tilman, D. 1999. Global environmental impacts of
agricultural expansion: the need for sustainable and efficient practices. Proc.
National Academy of Sciences of the United States of America. 96(11):5995-6000.
Wuest, S.B., and K.G. Cassman. 1992.
Fertilizer-nitrogen use efficiency of irrigated wheat: I. Uptake efficiency of
preplant versus late-season application. Agron. J. 84:682-688.
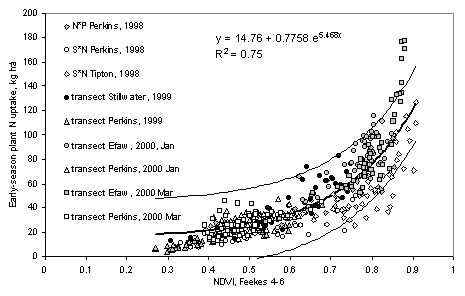
FIGURE 1.
Relationship between the normalized difference vegetation index computed
from red and near infrared reflectance readings from winter wheat at Feekes
physiological stages 4 to 6 and measured early-season plant N uptake from nine
experiments, 1998-2000.
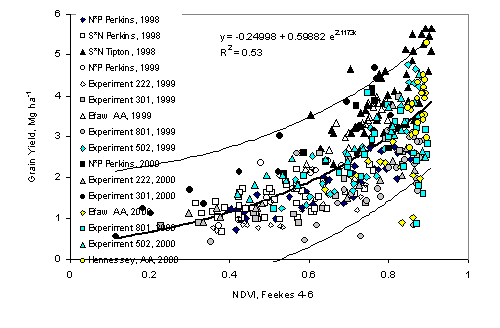
FIGURE 2.
Relationship between the normalized difference vegetation index computed
from red and near infrared reflectance readings from winter wheat at Feekes
physiological stages 4 to 6 and measured grain yield from sixteen experiments,
1998-2000.
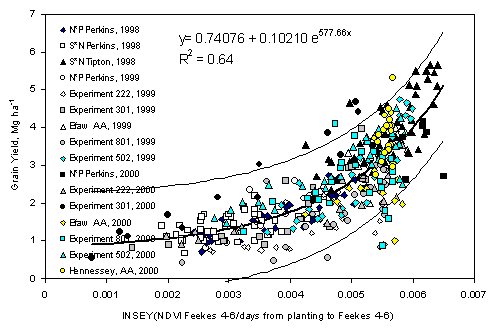
FIGURE 3.
Relationship between in season estimated grain yield (INSEY) computed
from NDVI readings collected between Feekes physiological growth stages 4 to 6,
divided by the number of days from planting to the reading date, and measured
grain yield from sixteen winter wheat experiments, 1998-2000.
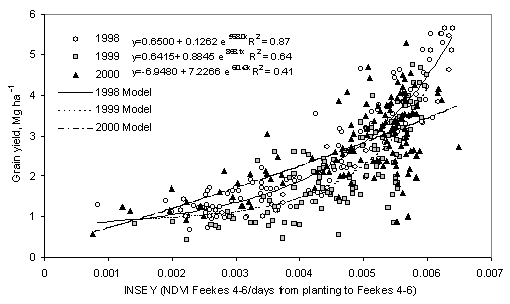
FIGURE 4.
Relationship between in season estimated grain yield (INSEY) computed
from NDVI readings collected between Feekes physiological growth stages 4 to 6,
divided by the number of days from planting to the reading date, and measured
grain yield (by year) from sixteen experiments, 1998-2000.
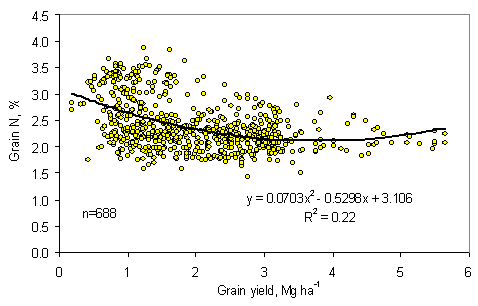
FIGURE 5.
Relationship between total N in wheat grain (%) and grain yield, from
multiple experiments conducted from 1980 to 2000.
TABLE 1. Nine
experiments where forage N uptake, and sensor readings were collected,
number of plots,
physiological growth stage, variety, and sensor/sampling date.
|
Experiment
|
Location
|
Year
|
No.
|
Date
|
Feekes
|
Planting
|
Variety
|
|
|
|
|
of
plots
|
Sensed
|
growth
|
date
|
|
|
|
|
|
sensed
|
D/M/Y
|
stage
|
D/M/Y
|
|
|
S*N§
|
Perkins, OK
|
1998
|
48
|
6/4/98
|
5
|
21/10/97
|
Tonkawa
|
|
|
|
|
|
|
|
|
|
|
S*N§
|
Tipton, OK
|
1998
|
48
|
26/2/98
|
5
|
7/10/97
|
Tonkawa
|
|
|
|
|
|
|
|
|
|
|
N*P¶
|
Perkins, OK
|
1998
|
36
|
2/4/98
|
5
|
21/10/97
|
Tonkawa
|
|
|
|
|
|
|
|
|
|
|
transect
|
Stillwater, OK
|
1999
|
50
|
26/3/99
|
6
|
13/10/98
|
Tonkawa
|
|
|
|
|
|
|
|
|
|
|
transect
|
Perkins, OK
|
1999
|
50
|
30/3/99
|
6
|
12/10/98
|
Tonkawa
|
|
|
|
|
|
|
|
|
|
|
transect
|
Efaw, OK
|
2000
|
50
|
18/1/00
|
4
|
7/10/99
|
Custer
|
|
|
|
|
|
|
|
|
|
|
transect
|
Efaw, OK
|
2000
|
50
|
20/3/00
|
5
|
7/10/99
|
Custer
|
|
|
|
|
|
|
|
|
|
|
transect
|
Perkins, OK
|
2000
|
50
|
19/1/00
|
4
|
8/10/99
|
Custer
|
|
|
|
|
|
|
|
|
|
|
transect
|
Perkins, OK
|
2000
|
50
|
20/3/00
|
5
|
8/10/99
|
Custer
|
§S*N,
row spacing by N rate experiment
¶N*P,
N rate by P rate experiment
TABLE 2. Sixteen
experiments where sensor and winter wheat grain yield data were collected,
planting and harvest date, and days from planting to sensing, 1998-2000.
|
Experiment
|
Location
|
Year
|
No.
|
Date
|
Planting
|
Harvest
|
Variety
|
Planting to
|
|
|
|
|
of plots
|
Sensed
|
date
|
date
|
|
sensing, days
|
|
|
|
|
|
D/M/Y
|
D/M/Y
|
D/M/Y
|
|
|
|
S*N§
|
Perkins, OK
|
1998
|
48
|
6/4/98
|
21/10/97
|
15/6/98
|
Tonkawa
|
167
|
|
S*N§
|
Tipton, OK
|
1998
|
48
|
26/2/98
|
7/10/97
|
3/6/98
|
Tonkawa
|
142
|
|
N*P¶
|
Perkins, OK
|
1998
|
36
|
2/4/98
|
21/10/97
|
15/6/98
|
Tonkawa
|
163
|
|
N*P¶
|
Perkins, OK
|
1999
|
12
|
4/3/99
|
12/10/98
|
9/6/99
|
Tonkawa
|
143
|
|
Experiment 222
|
Stillwater, OK
|
1999
|
20
|
24/2/99
|
13/10/98
|
15/6/99
|
Tonkawa
|
134
|
|
Experiment 301
|
Efaw, OK
|
1999
|
18
|
24/3/99
|
15/10/98
|
15/6/99
|
Tonkawa
|
160
|
|
Efaw AA
|
Efaw, OK
|
1999
|
21
|
24/3/99
|
9/11/98
|
15/6/99
|
Tonkawa
|
135
|
|
Experiment 502
|
Lahoma, OK
|
1999
|
28
|
5/3/99
|
9/10/98
|
30/6/99
|
Tonkawa
|
147
|
|
Experiment 801
|
Haskell, OK
|
1999
|
28
|
23/3/99
|
16/10/98
|
6/7/99
|
2163
|
158
|
|
N*P
|
Perkins, OK
|
2000
|
12
|
8/2/00
|
8/10/99
|
30/5/00
|
Custer
|
123
|
|
Experiment 222
|
Stillwater, OK
|
2000
|
20
|
6/3/00
|
7/10/99
|
6/7/00
|
Custer
|
151
|
|
Experiment 301
|
Efaw, OK
|
2000
|
18
|
6/3/00
|
7/10/99
|
2/6/00
|
Custer
|
151
|
|
Efaw AA
|
Efaw, OK
|
2000
|
21
|
6/3/00
|
7/10/99
|
7/7/00
|
Custer
|
151
|
|
Experiment 801
|
Haskell, OK
|
2000
|
28
|
14/3/00
|
8/10/99
|
2/6/00
|
2137
|
158
|
|
Experiment 502
|
Lahoma, OK
|
2000
|
28
|
13/3/00
|
12/10/99
|
13/6/00
|
Custer
|
153
|
|
Hennessey AA
|
Hennessey, OK
|
2000
|
21
|
13/3/00
|
7/10/99
|
7/6/00
|
Custer
|
158
|
§S*N,
row spacing by N rate experiment
¶N*P, N rate by P rate experiment
|