Library of Yield Prediction
Equations
Library of Yield Prediction
EquationsThis page and all associated mathematical equations have been shared with anyone interested in the development of sensor based algorithms, and has been shared since 2002. No other research group has gone to the effort of sharing all their data with others so as to improve our science.
Mathematical equations and the associated units (English or Metric) have not, will not, and cannot change as this would be fraudulent. All yield prediction equations, and the units for which they were developed, have remained the same since the inital loading date and year specified.
Clarifying "southern" for algorithms developed in Oklahoma has become necessary so as to communicate our region/environment.
This page and all others within our NUE website continues to change as new additions and formatting have been required, thus the requirement for citing a date when visiting web pages. We will continue to share everything we do, because it is right. No other N-management project in the world has been this transparent.
Last update: September 23, 2020
Joint Algorithm Evaluation:
1. If they didn't want OSU involved (refused to allow us to be a part of their study), why did they so agressively evaluate our algorithm? All sites evaluated were 400 to 850 miles north of Oklahoma. Why did they want to use an algorithm developed for 120-day corn under excessive heat for all their northern sites? To show that it wouldn't work? It won't work for corn grown in Alaska either.
Generalized Algorithm
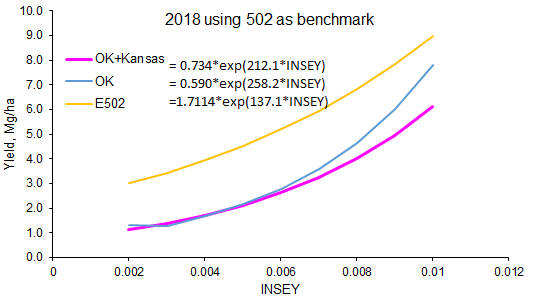
Winter wheat algorithm 2017 (option 1) YP0=590*EXP(INSEY*258.2)
Using only E502 Data, YP0 = 1711*EXP(INSEY*137) (this algorithm is more liberal and applies more N)
Corn algorithm (Southern US Grain Belt, options 21 (English units), 22 (Metric units))
INDEPENDENCE of Yield Potential and Nitrogen Response
(2013) 1. Relationship between Grain Crop Yield Potential and Nitrogen Response. Agron. J. 105:1335-1344.
(2010) 2. Independence of Yield Potential and Crop Nitrogen Response. Prec. Agric. DOI 10.1007/s11119-010-9196-z
Manuscripts Addressing Sensor Based Nitrogen Algorithms
(2001) 3. In-Season Prediction of Yield Potential Using Wheat Canopy Reflectance, Agron. J. 93:131-138(pdf)
(2001) 4. Nitrogen Fertilization Optimization Algorithm Based on In-Season Estimates of Yield and Plant Nitrogen Uptake J. Plant Nutr. 24:885-898
(2002) 5. Improving Nitrogen Use Efficiency in Cereal Grain Production with Optical Sensing and Variable Rate Application. Agronomy Journal, 94:815-820
(2002) 6. Real-Time Sensing and N Fertilization with a Field Scale GreenSeeker Applicator
(2002) 7. Improving Nitrogen Use Efficiency in Cereal Grain Production with Optical Sensing and Variable Rate Application. Agron J. 94:815-820.
(2003) 8. Identifying an In-Season Response Index and the Potential to Increase Wheat Yield with Nitrogen(pdf) Agron J. 95:347-351
(2004) 9. Evaluation of Green, Red, and Near Infrared Bands for Predicting Winter Wheat Biomass, Nitrogen Uptake and Final Grain Yield J. Plant Nutr. 27:1431-1441.
(2005) 10. Optical Sensor Based Algorithm for Crop Nitrogen Fertilization Commun. Soil Sci. Plant Anal. 36:2759-2781 (pdf)
(2005) 11. Growth Stage, Development, and Spatial Variability in Corn Evaluated Using Optical Sensor Readings J. Plant Nutr. 28:173-182 (pdf)
(2005) 12. Relationship Between Response Indices Measured In-Season and at Harvest in Winter Wheat. J. Plant Nutr. 28:221-235.
(2006) 13. Relationship Between Coefficient of Variation Measured by Spectral Reflectance and Plant Density at Early Growth Stages J. Plant Nutr. 29:1983-1997 (pdf)
(2006) 14. Mid-Season Prediction of Wheat Grain Yield Potential Using Plant, Soil, and Sensor Measurements. J. Plant Nutr. 29:873-897 (pdf)
(2006) 15. In-season prediction of corn grain yield potential using normalized difference vegetation index(Agron. J. 98:1488-1494)(pdf)
(2006) 16. Spectral Reflectance Indices as a Potential Indirect Selection Criteria for Wheat Yield under Irrigation. Crop Sci. 2006 46: 578-588.
(2007) 17. Use of In-Season Reflectance for Predicting Yield Potential in Bermudagrass. Commun. Soil Sci. Plant Anal. 38:1519-1531
(2007) 18. By-Plant Prediction of Corn Forage Biomass and Nitrogen Uptake at Various Growth Stages Using Remote Sensing and Plant Height Measures (Agron J. 99:530-536) (pdf)
(2007) 19. Potential Use of Spectral Reflectance Indices as a Selection Tool for Grain Yield in Winter Wheat under Great Plains Conditions. Crop Sci. 2007 47: 1426-1440.
(2008) 20. Adjusting Midseason Nitrogen Rate Using a Sensor-Based Optimization Algorithm to Increase Use Efficiency in Corn. J. Plant Nutrition. 31:1393-1419.
(2008) 21. Determination of optimum resolution for predicting corn grain yield using sensor measurements. Arch. Agron. Soil Sci. 54:481-491.
(2008) 22. Relationship between Nitrogen Use Efficiency and Response Index in Winter Wheat (J. Plant Nutr.) (pdf)
(2009) 23. In-season optical sensing improves nitrogen-use efficiency for winter wheat.
(2011) 24. Assessment of the nitrogen management strategy using an optical sensor for irrigated wheat. Agronomy Sust. Development. DOI 10.1007/s13593-011-0005-5
(2011) 25. Red edge as a potential index for detecting differences in plant nitrogen status in winter wheat. J. Plant Nutr. 35:1526-1541.
(2011) 26. By-plant prediction of corn grain yield using optical sensor readings and measured plant height.J. Plant Nutr. 35: 1429-1439.
(2012) 27. Generalized algorithm for variable-rate nitrogen application in cereal grains. Agron. J. 104:378-387.
(2012) 28. Evaluation of a reduced cost, active, NDVI sensor for crop nutrient management. J. of Sensors. doi:10.1155/2012/582028
(2012) 29. Use of soil moisture data for refined GreenSeeker sensor based nitrogen recommendations in winter wheat (Triticum aestivum L.). J. Prec. Agric. 14:343-356.
(2013) 30. Use of Optical Sensor Technology for the Fertilization of Wheat (Triticum aestivum L.) Terra Latinoamericana 31:95-103
(2014) 31. In season prediction of nitrogen use efficiency and grain protein in winter wheat, Triticum aestivum L.. Commun. Soil Sci. Plant Anal. 00:1-15. DOI:10.1080/00103624.2014.904337
(2015) 32. Algorithms for in-season Nutrient Management in Cereals. Agron J. 108:(5)
(2016) 33. Evaluation of mid-season sensor based nitrogen fertilizer recommendations for winter wheat using different estimates of yield potential
(2016) 34. Development of an in-season estimate of yield potential utilizing optical crop sensors and soil moisture data for winter wheat.
(2016) 35. Variability in Optimum Nitrogen Rates for Maize. Agron. J. 108:2165-2173. (doi:
(2017) 36. Predicting early season nitrogen rates of corn using indicator crops. Agron. J. 109:1-8 (2017
(2018) 37. Effect of nitrogen fertilizer source on corn (Zea mays L.) optical sensor response index values in a rain-fed environment. J. Plant Nutr. https://doi.org/10.1080/01904167.2018.1434202.
Wheat: INSEY = (NDVI / days from planting to sensing where GDD>0)
Corn: NDVI / cumulative GDD
NUE Conference, Generalized Algroithm (excel file), J. Solie, August 4, 2012
| # | Condition | Crop | Year | Equation | Units | NUE | RI Adjustment Equation |
| 1 | Dryland | Winter Wheat | 2002 | YP0=344*EXP(INSEY*267.65) | kg/ha | 50 | |
| 2 | Dryland | Winter Wheat | 2003 | YP0=500*EXP(INSEY*267.65) | kg/ha | 50 | |
| 3 | Dryland | Winter Wheat | 2004 | YP0=359*EXP(INSEY*324.4) | kg/ha | 50 | |
| 4 | Dryland | Winter Wheat | 2005 | YP0=522*EXP(INSEY*274.7) | kg/ha | 50 | RI Harvest = 1.69(RI-NDVI) -0.70 |
| 5 | Dryland | Winter Wheat | 2006 | YP0=532*EXP(INSEY*270.1) | kg/ha | 50 | RI Harvest = 1.69(RI-NDVI) -0.70 |
| 6 | Dryland | Winter Wheat | 2016 | YP0=590*EXP(INSEY*258.2) this includes 1SD | kg/ha | 50 | RI Harvest = 1.69(RI-NDVI) -0.70 |
| 7 |
|
Winter Wheat (Uses Benchmark YP0 prediction from Exp. 502) |
2018 |
YP0=1711*EXP(INSEY*137.2) | kg/ha | 70 | RI Harvest = 1.69(RI-NDVI) -0.70 |
| 8 | Dryland | Winter Wheat | 2007 Mod |
CoefA = 0.383516x2 - 91.989634x + 6214.147063 CoefB = -0.000423x2 + 0.099424x - 3.746111 YP0 = (CoefA * EXP (CoefB * NDVI)) |
kg/ha | 50 | RI Harvest = 1.69(RI-NDVI) -0.70 |
| Dryland | Winter Wheat, KSU-OSU | 2015 | YP0=734.57*EXP(INSEY*212.14) | kg/ha | 50 | RI Harvest = 1.11(RI-NDVI) + 0.11 | |
| 9 | Dryland | Winter Wheat-Forage | 2007 | YP0 = 159.57*EXP(3.909*NDVI) | kg/ha | 50 | |
| 10 | Dryland & Irrigated | Durum Wheat | 2006 | YP0=322*EXP(INSEY*211.5) | kg/ha | RI Harvest = 1.69(RI-NDVI) -0.70 | |
| 11 | Dryland & Irrigated | Durum Wheat (for increased protein) | 2006 | YP0=322*EXP(INSEY*211.5)* *apply 20 kg N/ha when projected yield exceeds 4000 kg/ha | kg/ha | ||
| 12 | Rainfed | Wheat-Southern Australia, David Cox | 2006 | YP0=1800*EXP(INSEY*85) | kg/ha | 60 | RI Harvest = 1.69(RI-NDVI) -0.70 |
| 13 | Rainfed | Wheat, E. Australia, R. Heath | 2006 | YP0=580*EXP(INSEY*244.94) | kg/ha | 60 | RI Harvest = 1.69(RI-NDVI) -0.70 |
| 14 | Rainfed Bolivia | Maiz (Corn), Bolivia | 2017 | YP0=201.62*EXP(INSEY*195.09) | kg/ha | 60 | INSEY= NDVI / dias desde la siembra a la medida |
| 15 | Irrigated | Corn | 2003 | YP0=2332.9*(EXP(INSEY*132.46) | kg/ha | 50 | |
| 16 | Dryland | Corn | 2003 | YP0=1633*(EXP(INSEY*132.46) | kg/ha | 50 | |
| 17 | Dryland & Irrigated | Corn | 2004 | YP0=1565*(EXP(INSEY*154.7) | kg/ha | 50 | RI Harvest = 1.64(RI-NDVI) - 0.5287 |
| 18 | Rainfed | Corn (1st planting, Argentina) | 2005 | YP0=1941*(EXP(INSEY*162) | kg/ha | 50 | RI Harvest = 1.64(RI-NDVI)-0.5287 |
| 19 | Irrigated | Corn (2nd planting, Argentina) | 2005 | YP0=624*(EXP(INSEY*149.41) | kg/ha | 50 | |
| 20 | Rainfed | Corn (USA) | 2006 | YP0=1202*(EXP(INSEY*169.6) | kg/ha | 50 | RI Harvest = 1.64(RI-NDVI)-0.5287 |
| 21 | Irrigated/Rainfed |
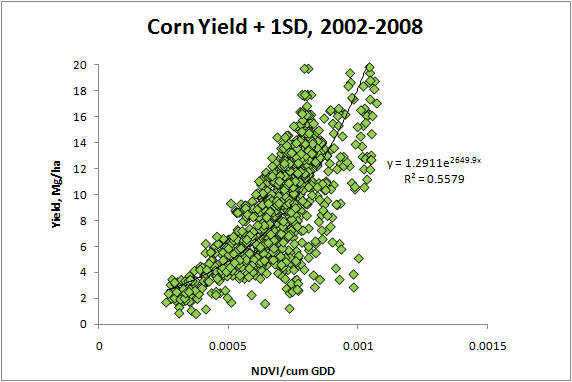
Corn USA, Cummulative GDD, Southern US Grain Belt ** because of the misuse of these equations for northern US regions, we can work with you to generate YP0 functions specific to your state/area. This version is in Metric units and has been metric since 2007. (in All_2018_CornYield_GDD.xls) |
2007 | YP0=2592*(EXP(NDVI/Sum of GDD*1775.6) | kg/ha | 50 | RI Harvest = 1.64(RI NDVI) -0.5287 |
| 22 | Irrigated/Rainfed |
Corn USA, Cummulative GDD, Southern
US Grain Belt * because of the misuse of these equations for northern US regions, we can work with you to generate YP0 functions specific to your state/area. This version is in English units and has been in English units (bu/ac) since 2009. |
2009 | YP0=1.291*(EXP(NDVI/Sum of GDD*2649.9) | bu/ac | RI Harvest = 1.64(RI NDVI) -0.5287 | |
|
http://uspest.org/cgi-bin/usmapmaker.pl USA link for computing cumualtive GDD |
|||||||
| 23 | Corn | Colombia | 2014 | YP0 =1633*(EXP(INSEY*132.4)) | 60 | ||
| 24 | Corn | Colombia (Llanos orientales) | 2015 | YP0=60.9*(EXP(INSEY*252.6)) | kg/ha | 60 | |
| 25 | Rainfed | Corn Ohio | 2008 | YP0=1287*(EXP(NDVI/Sum of GDD*2655) | kg/ha | RI Harvest = 1.64(RI NDVI) -0.5287 | |
| 26 | Irrigated/Rainfed | Corn (USA), days from planting to sensing | 2007 |
CoefA = 11.777*(days*days) - 1485.4*(days)+48533 CoefB = -0.0008(days*days) + 0.1402*(days)-3.3851 YP0 = (CoefA * EXP (CoefB * NDVI)) days = days from planting to sensing |
kg/ha | RI Harvest = 1.64(RI NDVI) -0.5287 | |
| 27 |
Irrigated/Rainfed |
Corn (USA) Using Cumulative GDD |
2007 |
CoefA=641.4158203057011+4207.148880805758/(1.0+EXP(-(x-897.0822110817790)/(-32.78891349907328))) CoefB=1.46923333343772+1.8752166665474/(1+EXP(-(x-912.164821648278)/2.66689327528455)) |
kg/ha |
|
RI Harvest = 1.64(RI NDVI) -0.5287 |
| 28 | Rainfed | Sorghum | 2005 | YP0=72*(EXP(INSEY*296.2) | kg/ha | none | |
| 29 | Sorghum KSU-OSU | 2006 | YP0=633*(EXP(INSEY*141.94) | ||||
| 30 | Sorghum KSU | 2007 | YP0=58.689*(EXP(INSEY*273.47) | kg/ha | RI-Harvest=2.104*RI NDVI -1.044 | ||
| 31 | Rainfed, 50% NUE | Sorghum OSU-KSU 2008 | 2008 | YP0=183.37*(EXP(INSEY*217.7) | kg/ha | RI Harvest = 1.69*RI NDVI -0.7 | |
| 32 | Irrigated | Spring Wheat Mexico | 2003 | YP0=701*EXP(INSEY*154.91) | kg/ha | 60 | |
| 33 | Irrigated | Spring Wheat Mexico | 2006 | YP0=989*EXP(INSEY*130.65) | kg/ha | 60 | |
| 34 | Irrigated |
Spring Wheat Mexico (Melgas) |
2007 | YP0=1250*EXP(INSEY*106.12) | kg/ha | 60 | |
| 35 | Irrigated |
Spring Wheat, Baja California, Jesus Santillano |
2014 | YP0=1087.9*EXP(INSEY*134.69) | kg/ha | 60 | |
| 36 | Irrigated | Spring Wheat, Baja California, Jesus Santillano | 2015 |
y = 1.0811e(INSEY*135.134) |
kg/ha | 60 | RI Harvest = 1.69*RI NDVI - 0.7 |
| 37 | Rainfed | Spring Wheat INDIA (67-73 days after planting) | 2006 | YP0=838*EXP(INSEY*177.12) | kg/ha | 60 | |
| 38 | Rainfed |
Spring Wheat Argentina |
2007 | YP0=680,547*EXP(NDVI*2701) NDVI a inicios de encanazon | kg/ha | 60 | |
| 39 | Rainfed | Canada, Spring Wheat | 2009 | YP0=853.2*exp902.9x where x=NDVI/GDD0 where GDD0= Sum of daily GDD, base-temp = 0C | RI=(RINDVI*1.105)+0.02(max of 2) | ||
| 40 | Dryland | Spring Wheat Canada | 2005 | YP0 = 1659*(exp(732.72*INSEY)) | kg/ha | 60 | |
| 41 | Dryland |
Spring Wheat Canada |
2008 | YP0 = 996.3*(exp(1779*INSEY)) INSEY = NDVI/sum of GDD in F | kg/ha | 60 | RI Harvest = 1.69(RI-NDVI) -0.70 |
| 42 | Dryland | Bermudagrass | 2006 | YP0 = 728.8*(exp(639.5*(INSEY)) | kg/ha | 40 | none |
| 43 | Dryland | Canola Canada | 2005 | YP0=1408.3*exp(744.61*INSEY) | kg/ha | ||
| 44 | Dryland | Canola Canada | 2008 | YP0=885.7*exp(881.5*INSEY), INSEY = NDVI/sum of GDD | kg/ha | RI-Harvest=1.69*RI-NDVI - 0.7 | |
| 45 | Dryland | Canola Canada | 2009 | YP0=701.9*exp(632.9x) x=NDVI/GDD0, sum of daily GDD, baste temp = 5C | |||
| 46 | Rainfed | Rice INDIA, 64-28 days after planting | 2006 | YP0=2104*EXP(INSEY*124.96) | kg/ha | 60 | |
| 47 | Rainfed |
North Central Cotton |
2010 | YP0=29.32*EXP(INSEY*4725) INSEY = NDVI/ cum GDD | kg/ha | 50 | RI harvest = 3.33*RI NDVI - 2.315 |
| 48 | Irrigated |
South West Irrigated Cotton |
2010 | YP0=231.6*EXP(INSEY*3668.1) INSEY = NDVI/ cum GDD | kg/ha | RI harvest = 3.33*RI NDVI - 2.315 | |
| 49 | Dryland | Cotton | 2008 | YP0= 235.96*EXP(INSEY*2216.2) INSEY = NDVI/ cum GDD, with 60F as lower threshold (range of 50 to 80) | 50 | RI harvest = 1.8579*RI NDVI - 0.932 | |
| 50 | Dryland | Malting Barley | 2006 | ||||
| Fert N, $/lb | 0.5 | NDVI, Nrich | 0.83 | RI | RI Harv | 2006 | RI Harvest = 1.69(RI-NDVI) - 0.70 | |||
| Grain, $/bu | 5.5 | NDVI, FP | 0.7 | 1.19 | 1.30 | 2018 | RI Harvest = 1.23(RI-NDVI) + 0.48 | |||
| 1.19 | 1.45 | 2018 | RI Harvest = 0.9213(RI-NDVI) + 0.36 | |||||||
| Expeceted Fert. Effic. | 0.7 | |||||||||
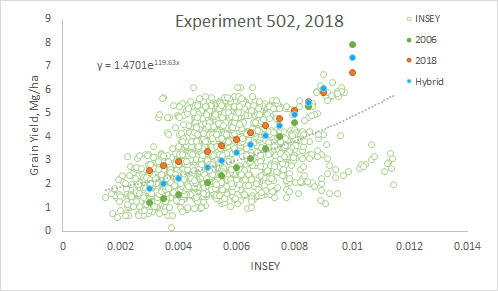
| 2006 | 2016 | 2018 | Hybrid | N Rate-H | N Rate-2018 | N Rate 2006 | 2018 | |||
| INSEY | Mg/ha | Mg/ha | Mg/ha | Mg/ha | no efficiency factor | YP0=1.711*EXP(INSEY*137.2) | ||||
| 0.003 | 1.196245869 | 1.280137 | 2.58274232 | 1.822119 | 18.90366446 | 27.92545156 | 12.4105138 | |||
| 0.0035 | 1.369215859 | 1.456545 | 2.7661093 | 2.013753 | 20.89178021 | 29.90807514 | 14.20499979 | 2016 | ||
| 0.004 | 1.567196274 | 1.657263 | 2.96249479 | 2.225541 | 23.08898791 | 32.03145906 | 16.25895771 | YP0=590*EXP(INSEY*258.2) | ||
| 0.005 | 2.053176714 | 2.145488 | 3.39808402 | 2.718282 | 28.20095352 | 36.7411917 | 21.30078657 | |||
| 0.0055 | 2.350053774 | 2.441145 | 3.63933783 | 3.004166 | 31.16687369 | 39.34970647 | 24.38075278 | 2006 | ||
| 0.006 | 2.689857479 | 2.777544 | 3.89771993 | 3.320117 | 34.44472241 | 42.14341799 | 27.90606365 | YP0=532*EXP(INSEY*270.1) | ||
| 0.0065 | 3.078794765 | 3.160301 | 4.17444639 | 3.669297 | 38.06730549 | 45.13547467 | 31.94111337 | |||
| 0.007 | 3.523970054 | 3.595803 | 4.47081961 | 4.0552 | 42.07087895 | 48.33995844 | 36.55960712 | HYBRID | ||
| 0.0075 | 4.033515025 | 4.091318 | 4.78823443 | 4.481689 | 46.49551192 | 51.77195096 | 41.84590742 | YP0=1000*EXP(INSEY*200) | ||
| 0.008 | 4.616737147 | 4.655118 | 5.12818476 | 4.953032 | 51.38548759 | 55.4476047 | 47.89657508 | |||
| 0.0085 | 5.284289696 | 5.296611 | 5.49227055 | 5.473947 | 56.7897465 | 59.38421887 | 54.82213306 | |||
| 0.009 | 6.048366347 | 6.026505 | 5.88220534 | 6.049647 | 62.76237628 | 63.60032087 | 62.74908526 | |||
| 0.01 | 7.923937254 | 7.8019 | 6.74709302 | 7.389056 | 76.65813949 | 72.95176836 | 82.20729133 | |||
|
CROP |
Percent N, % |
Test weight, lb/bu |
|
Maize (Colombia) |
1.55 |
56 |
|
Maize (Argentina) |
1.24 |
56 |
|
Maize (USA) |
1.25 |
56 |
|
Maize (Minnesota) |
1.23 |
56 |
|
Winter Wheat |
2.39 |
60 |
|
Winter Wheat (Kansas) |
2.10 |
60 |
|
Winter Wheat Forage |
2.46 |
|
|
Spring Wheat (Ciudad Obregon) |
2.45 |
60 |
|
Spring Wheat (Baja California) |
2.10 |
60 |
|
Spring Wheat (Dakota's) |
2.40 |
60 |
|
Wheat Argentina |
2.20 |
60 |
|
Sorghum |
1.95 |
56 |
|
Sorghum KANSAS |
1.96 |
56 |
|
Spring Wheat (Canada) |
2.23 |
60 |
|
Wheat S-Australia |
2.00 |
60 |
|
Wheat E Australia |
2.25 |
60 |
|
Bermudagrass |
2.00 |
na |
|
Spring Wheat Argentina |
1.95 |
60 |
|
Spring Wheat (India) |
1.60 |
60 |
|
Rice (India) |
1.28 |
45 |
|
Cotton Lint |
8.64 |
|
|
Durum Wheat |
2.24 |
60 |
|
Canola (Canada) |
3.30 |
50 |
|
Crop |
Range(%) |
Average(%) |
Source |
|
Spring Wheat |
2.00-2.649 |
2.39% |
Hopkins, J.W.
1968. Protein content of western canadian hard red spring wheat in
relation to some environmental factors. Ag. Meteorology. |
|
Winter Wheat |
1.6-2.8 |
2.29% |
Debaeke, P.,
Aussenac, T., Fabre, J.L., Hilaire, A., Pujol, B., and Thuries, L.
1996. Grain nitrogen content of winter bread wheat (Triticium
aestivum L.) as related to crop management and to the previos
crop. Europen Journal of Agronomy. 5(1996) 273-286. |
|
Corn |
1.23-1.46 |
1.31 |
Heckman, J.R.,
J.T. Sims, D.B. Beegle, F.J. Coale, J. Herbert, T.W. Bruulsema,
and W.J. Bamka. 2003. Nutrient removal by corn grain harvest.
Agronomy Journal. 95: 587-591. |
|
Corn (grain) |
|
1.1%N |
Potash and
Phosphate Institute. 2001. Nutrients removed in the harvest
portion of a crop [Online]. Available at http://www.ppi-ppic.org/
(verified 30 Jan. 2012). Potash and Phosphate Inst., Norcross, GA. |
|
Corn (silage, 67% water) |
|
9.7(lb/ton) |
Potash and
Phosphate Institute. 2001. Nutrients removed in the harvest
portion of a crop [Online]. Available at http://www.ppi-ppic.org/
(verified 30 Jan. 2012). Potash and Phosphate Inst., Norcross, GA. |
|
Sorghum |
0.99-1.68 |
1.34 |
Jones C. A.
1983. Field Crop Research 6: 133-147 |
|
Sorghum |
1.60-1.69 |
1.65 |
Mucho R. 1990.
Effect of nitrogen on partitioning and yield in grain sorghum
under differing environmental conditions in the semi-arid tropics.
Field Crop Research 25: 265-278 |
|
Sorghum |
|
2.44 |
Mucho R. 1990.
Effect of nitrogen on partitioning and yield in grain sorghum
under differing environmental conditions in the semi-arid tropics.
Field Crop Research 25: 265-278 |
|
Canola |
3.2-4 |
3.6 |
R. F. Brennan,
M. G. Mason & G. H. Walton (2000). Effect of nitrogen fertilizer
on the concentrations of oil and protein in canola (brassica napus)
seed 23:3, 339-348 |
|
Canola |
3.12-3.42 |
3.25 |
E. Assadi, H.
Janmohammadi, A. Taghizadeh, and S.Alijani (2011). Nutrient
composition of different varities of full-fat canolaseed and
nitrogen-corrected true metabolizable energy of full fat canola
seed with or without enzyme addition and thermal processing
:20:95-101
|
|
Canola |
3.5-3.81 |
3.64 |
O.Ozturk, S.
Soylu, R. Ada, S. Gezgin, and Babaoglu (2010).Studies on
Differential Response of Spring Canola Cultivars to Boron
Toxicity .33 :1141-1154 |
|
Sunflower (seed) |
3.67-4.61 |
4.41 |
Robinson,
R.G.1975.Amino Acid and Elemental Composition of Sunflower and
Pumpkin Seeds. Ag.J Vol.67 pg.541-544
N to protein factor (6.10) |
|
Sunflower |
3.35-3.93 |
3.64 |
Gholinezhad, E., Aynaband, A., Ghorthapeh, A.H., Noormohamadi, G., and Bernousi, I. 2011.Effect of drought stress and nitrogen rates on grain yield, quality traits and physiological indices in sunflower hybid iroflor at different plant density. World Applied Sciences J. 14(1): 131-139. |
Protein =%N x
6.25 or %N x 5.7 in case of wheat grain
1 percent N = 10,000 ppm
1 percent N = 10,000 mg/kg
1 percent N = 10,000 ug/g
1 percent N = 10 g/kg
g/kg = percent
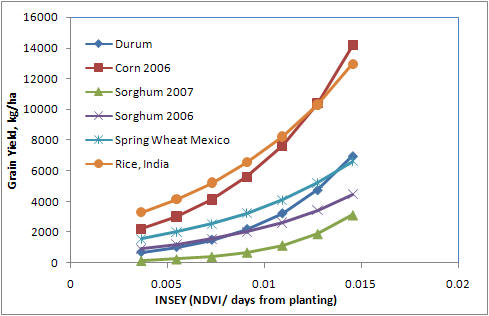
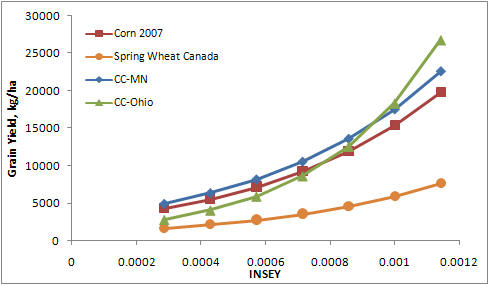
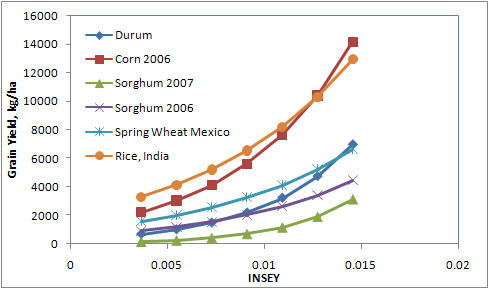
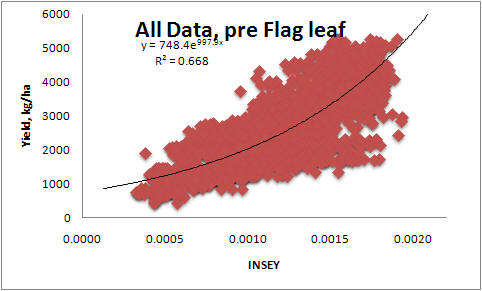
In the figure above, 6 yield potential equations are reported for winter wheat, spring wheat, dryland corn and irrigated corn. As is noted, the 6 equations are really quite similar. This is important when considering that the winter wheat equation came from data in Oklahoma, spring wheat from North Dakota, South Dakota, and Mexico, and Corn (both irrigated and dryland), from Mexico, Nebraska, and Oklahoma. Each production region (country or state specific) may well have minor adjustments that are needed (variety, planting date, etc.), but for the most part these yield potential predictive equations should be accurate. Regardless, what is apparent here is that all grain yield prediction equations will have the same form. The importance of the yield potential equations is that they accurately reflect what the "yield potential" will be for the growing conditions encountered within a specific year. "Yield potential" changes from year to year in the exact same field, largely due to temporal variability. Also, looking at the graphs, our estimate of yield potential is the "yield" you hope to grow given the "current" growth rate (on the day of sensing), thus, the outer edge of the data set is used, and estimated by adding 1 standard deviation along the entire exponential curve. For all crops (see figures below), very few data points were encountered in the upper left hand corner, noting that this outer edge represented a rather clean upper boundary. As is noted above, the YP0 equation for wheat is somewhat different that the other crops, largely because many of the days from planting to sensing have GDD<0 (growing degree days or Tmin+Tmax/2 - 4.4°C), where growth is not possible. The growth curve (biomass produced per day), estimated using NDVI (excellent predictor of biomass) has proven to be a reliable parameter for estimating harvested grain yield in winter wheat, spring wheat, and corn (both dryland and irrigated). Actual data for all equations is shown below.
Spring wheat (Ciudad Obregon), employs a different strategy whereby
"maximum yields" can theoretically be achieved from in-season N
applications, regardless of how severe the N stress is. This is
consistent with previous studies conducted by Ivan Ortiz-Monasterio
showing that the plants can completely recover, provided that the N is
applied before Feekes 5, or Zadoks 30 to 31. Also, the spring
wheat algorithm adjusts for "projected N removed" based on an equation
established at CIMMYT (figure below).
Figure 2. Relationship between grain
N removed in spring wheat, and grain yield, developed at Ciudad Obregon.
Spring Wheat, Canada, 2004-2007
Restrictions
Corn (V8 to V10)
Winter Wheat (Feekes
5 to
Feekes 7)
Spring Wheat (prior to
Feekes
7)
INSEY versus Winter Wheat Grain Yield, for 1998-1999 (9 Loc's) and 1998-2004 (35 Loc's), and 2004 (5 Loc's) versus 1998-2004 (35 Loc's). The ability to establish a yield prediction equation from only one year of data (5 Loc's in 1994) is delineated in the above graph when compared to the yield predication equation for all 35 sites from 1998 to 2004 and that spanned 7 years.

| RI NDVI versus RI Harvest 2018 | |||
| y = 0.9213x + 0.3602 | |||
| x 1SD | y=1.225x + 0.479 | ||