By Plant Variability in Corn Grain Yield (46 transects)
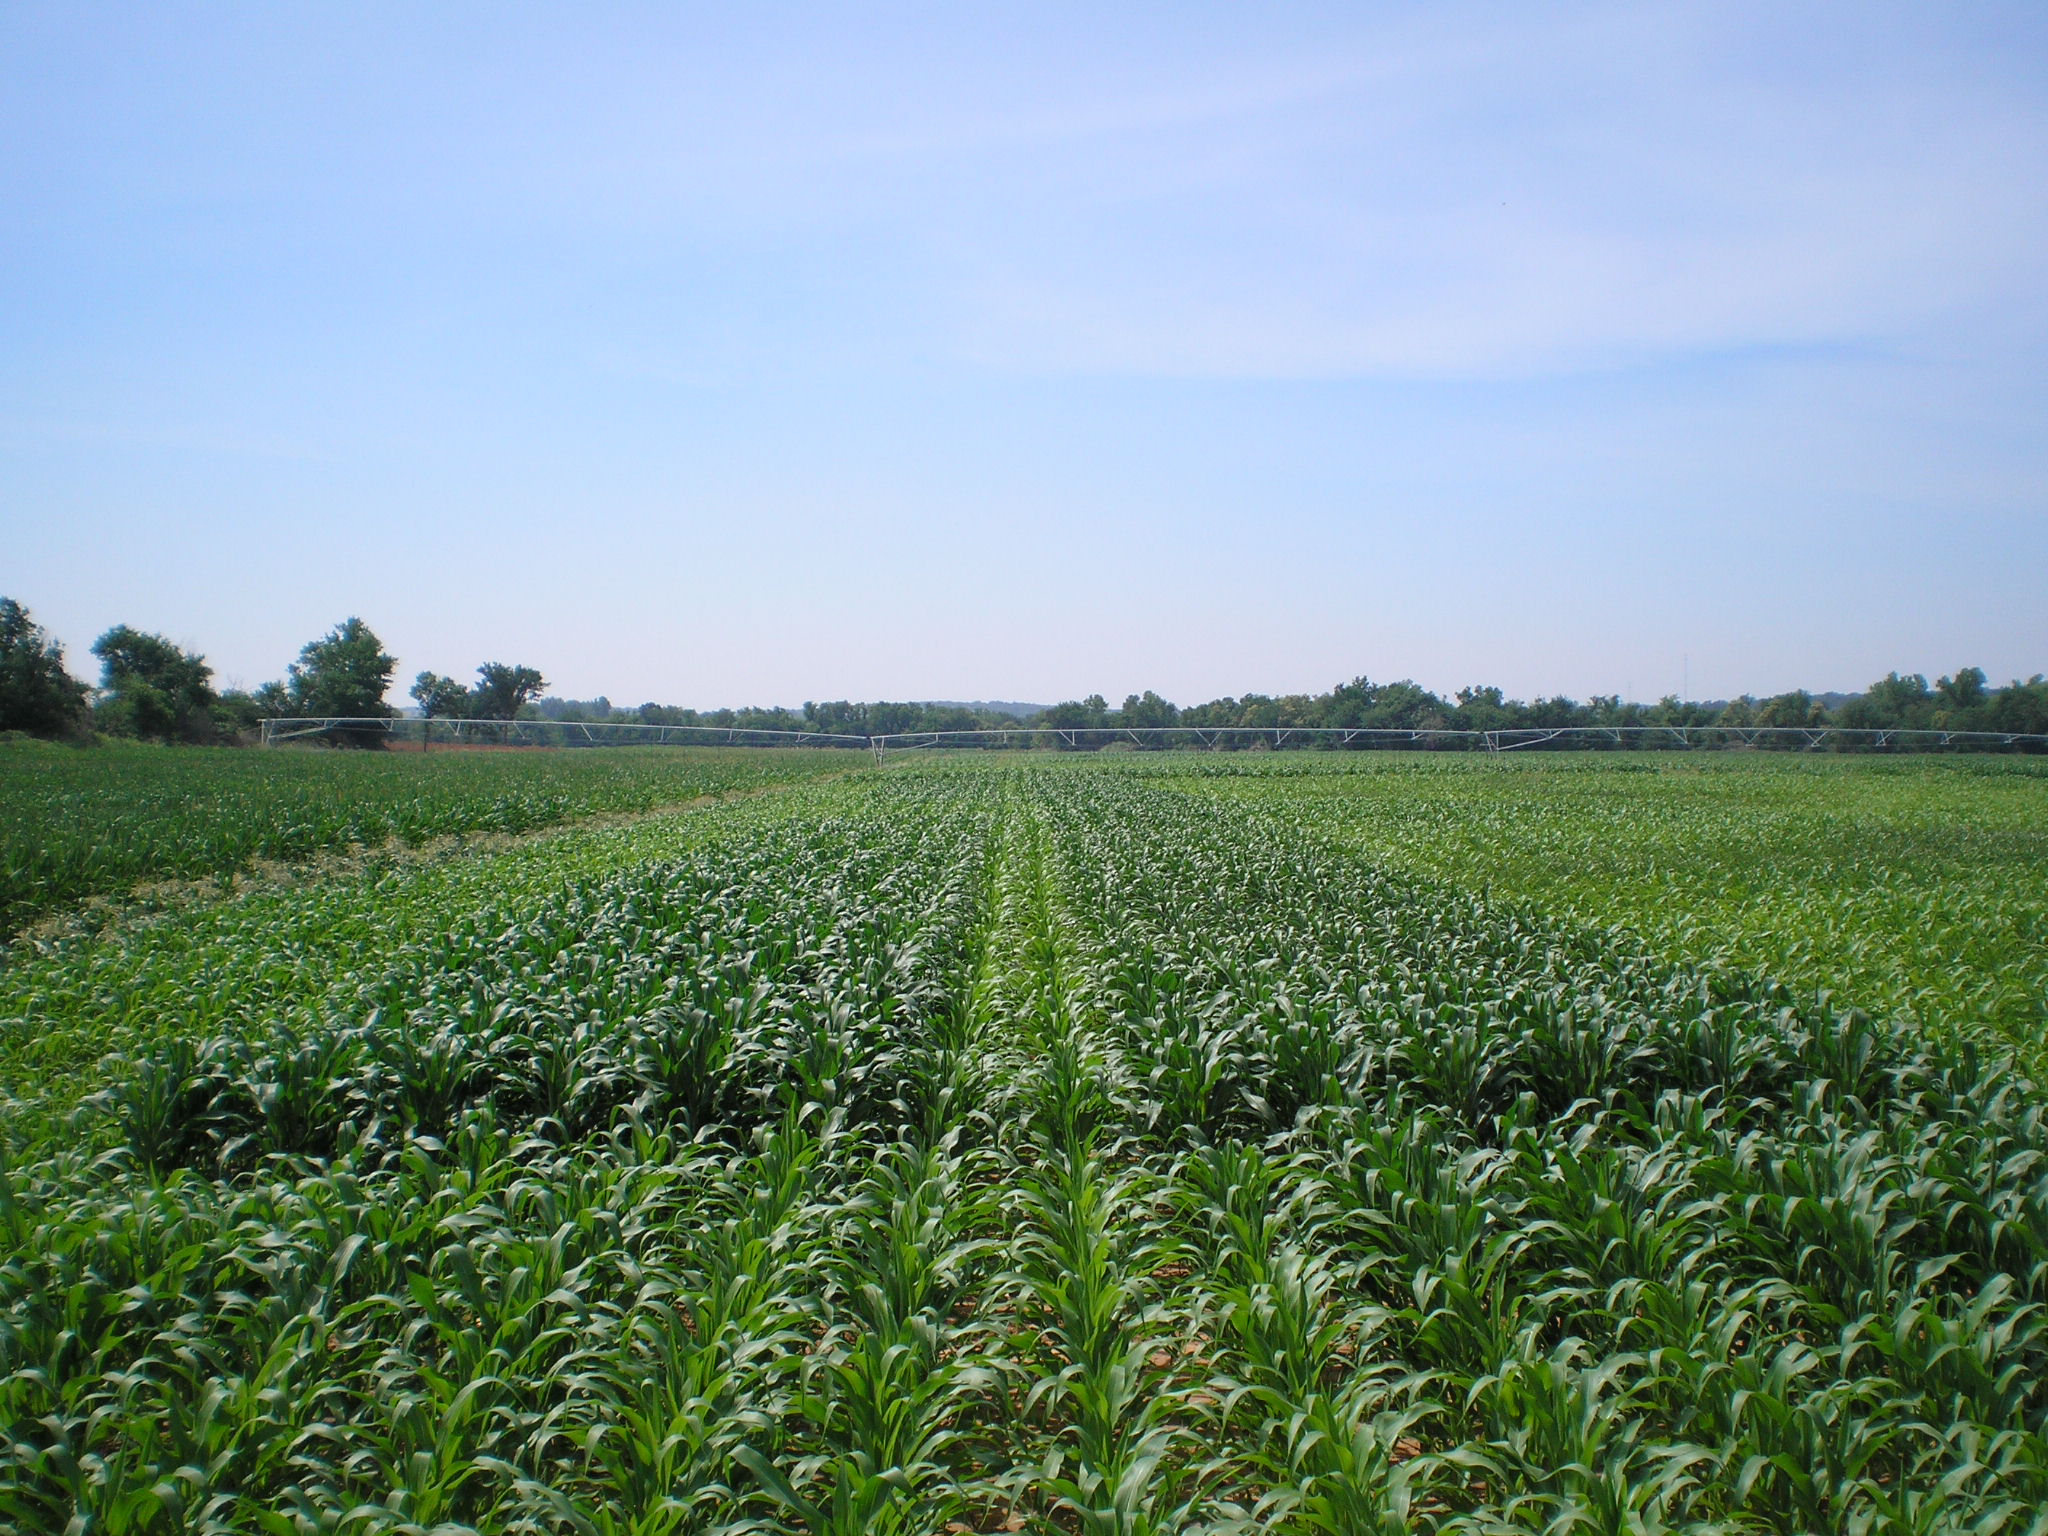
T&L Lateral Move system, Lake Carl Blackwell
Plant to Plant Variability in Corn Production (Agron. J. 97:1603-1611) (pdf)
Irrigation Manual, T&L Lateral Move system, Lake Carl Blackwell, prepared by Jared Crain
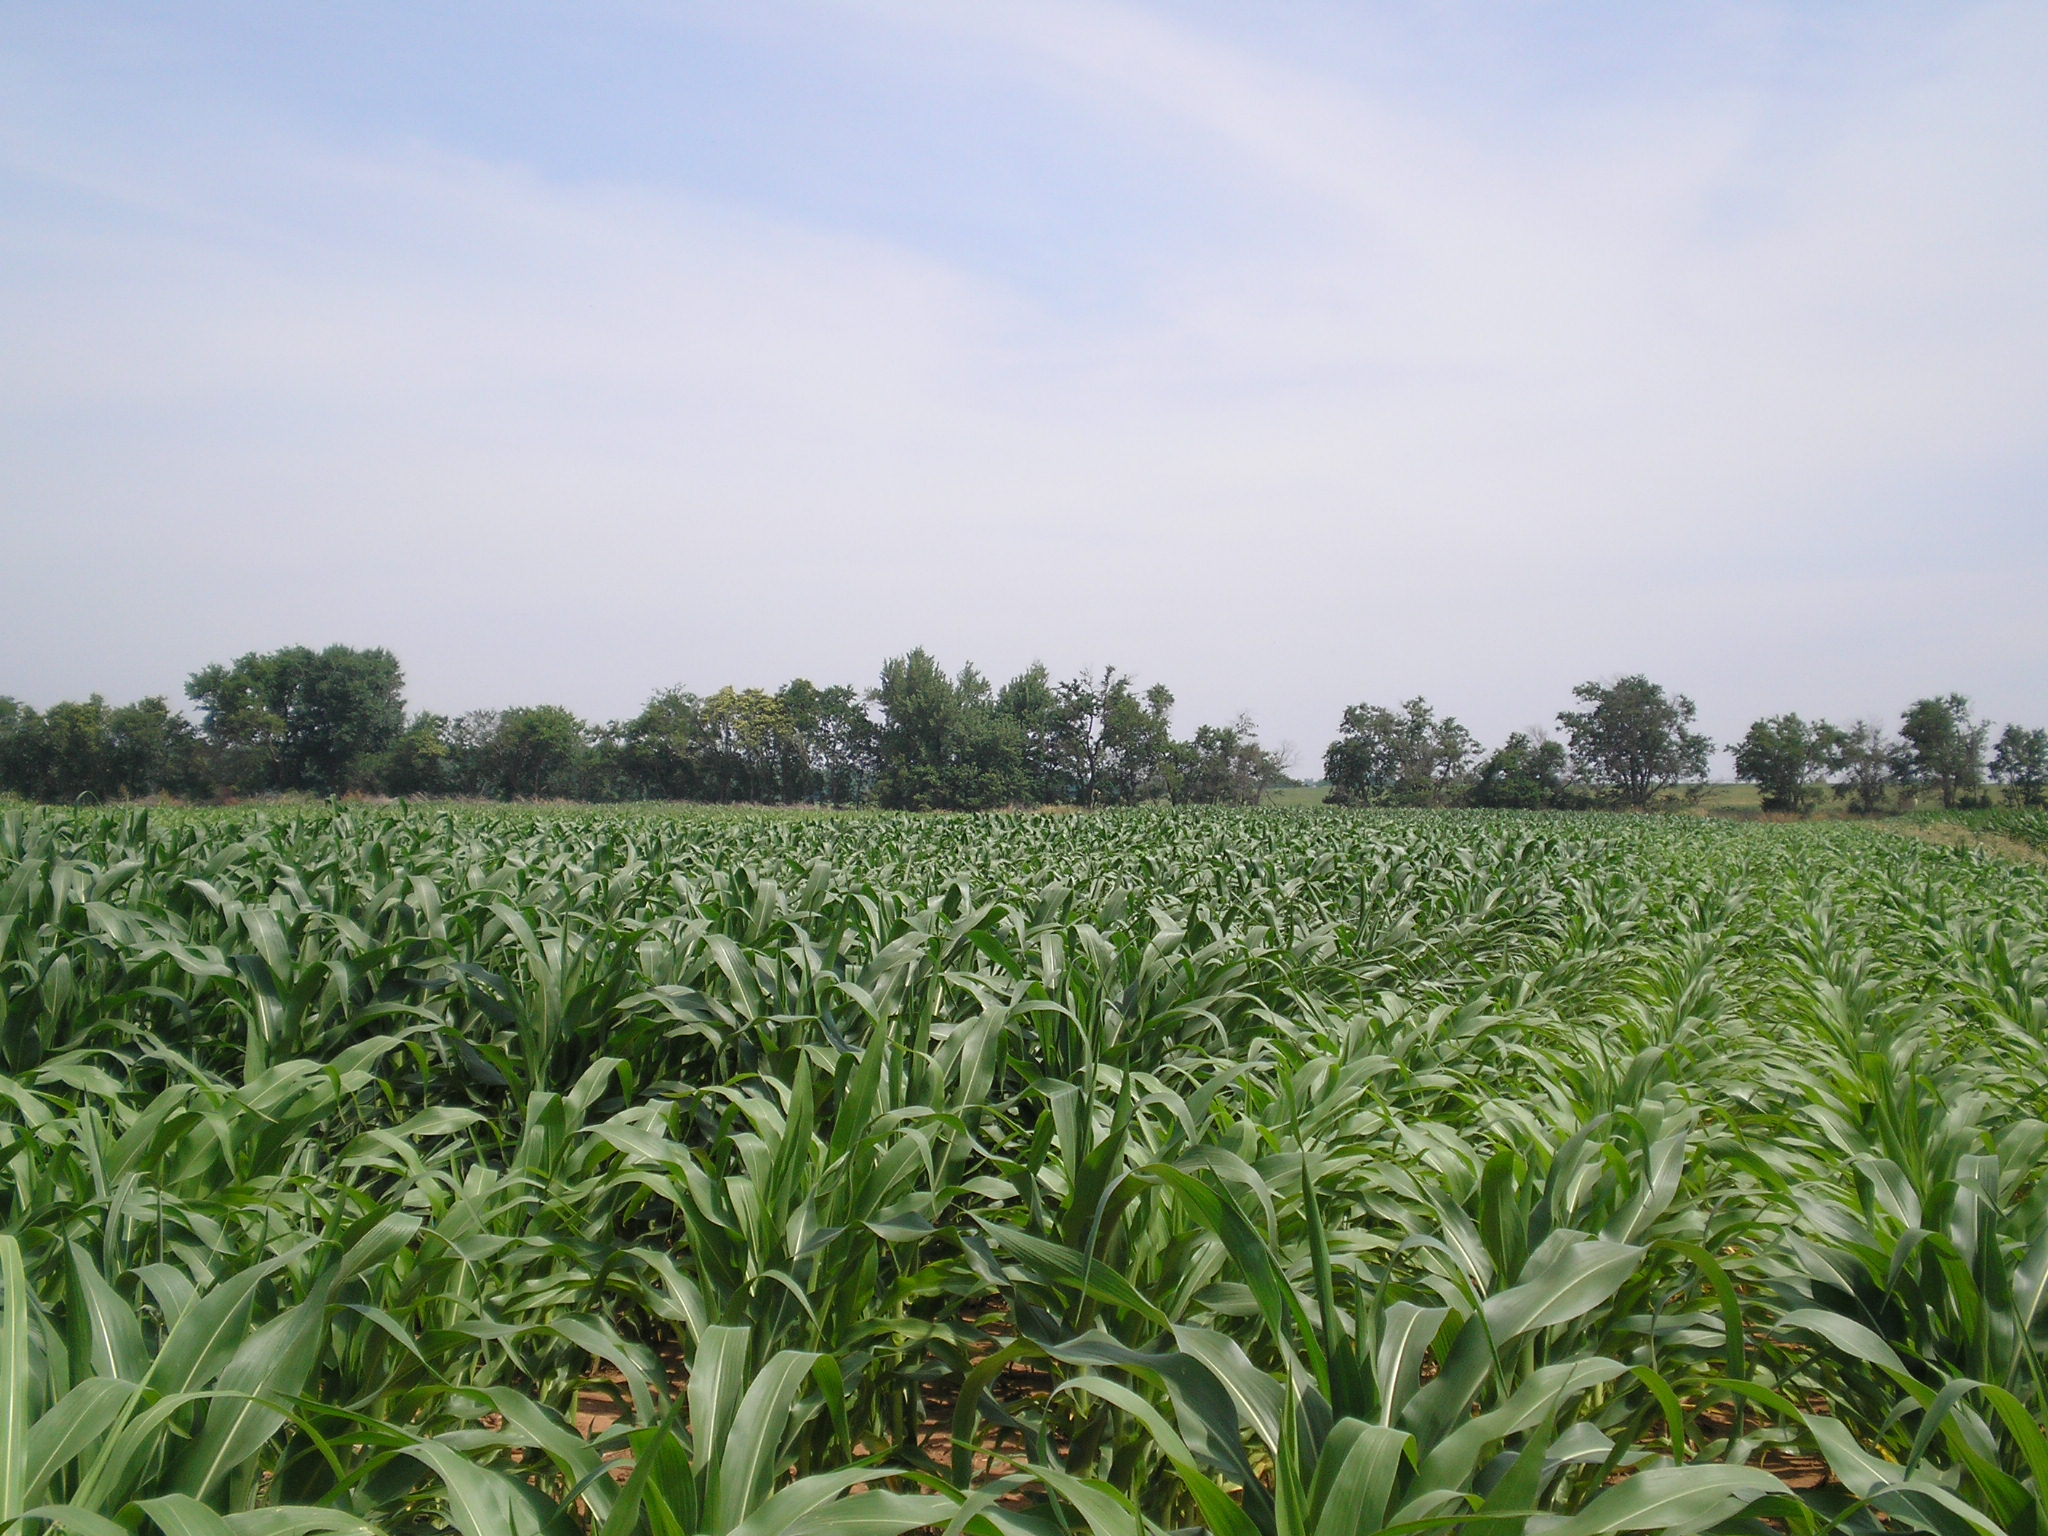
Lake Carl Blackwell Corn Experiments, T&L Lateral Irrigation System (pictures)

Predicting By-Plant Corn Yields
Sources:
http://faostat.fao.org/
http://www.usda.gov/nass/nasshome.htm
| transect length: 30m | ||||||||
| OKLAHOMA | ||||||||
| Location | Year | Row # | Min Yield | Max Yield | Mean Yield | Std. Dev | Max/Min | CV |
| kg/ha | kg/ha | kg/ha | kg/ha | % | ||||
| Perkins-Kyle 2004 | 2004 | 1 | 684.82 | 4556.38 | 2725.48 | 972.79 | 6.65 | 36 |
| Lake Carl Blackwell | 2003 | 3 | 711.62 | 6680.19 | 3448.77 | 1483.63 | 9.39 | 43 |
| Lake Carl Blackwell | 2004 | 4 | 1293.41 | 8583.40 | 4093.69 | 1484.69 | 6.64 | 36 |
| Lake Carl Blackwell | 2004 | 5 | 1094.46 | 9069.39 | 4360.87 | 1419.29 | 8.29 | 33 |
| Lake Carl Blackwell | 2003 | 4 | 1126.86 | 10940.16 | 4539.05 | 2316.58 | 9.71 | 51 |
| Hennessey | 2004 | 2 | 651.59 | 8140.50 | 4631.17 | 1850.56 | 12.49 | 40 |
| Hennessey | 2004 | 1 | 1399.42 | 8871.36 | 4678.98 | 1587.36 | 6.34 | 34 |
| Lake Carl Blackwell | 2004 | 3 | 548.56 | 10190.88 | 4854.80 | 1537.67 | 18.58 | 32 |
| Lake Carl Blackwell | 2004 | 6 | 1926.66 | 8810.50 | 5059.42 | 1365.76 | 4.57 | 27 |
| Lake Carl Blackwell | 2004 | 1 | 471.21 | 11213.38 | 5783.17 | 2466.17 | 23.80 | 43 |
| EFAW | 2004 | 4 | 2157.53 | 10146.65 | 5806.38 | 1576.39 | 4.70 | 27 |
| Lake Carl Blackwell | 2004 | 2 | 1472.33 | 12824.38 | 5847.75 | 2631.68 | 8.71 | 45 |
| <100 bu/ac | ||||||||
| Average (kg/ha) | 1128.21 | 9168.93 | 4652.46 | 1724.38 | 9.99 | 37.16 | ||
| Average (bu/ac) | 17.99 | 146.19 | 74.18 | 27.49 | ||||
| kg/ha | kg/ha | kg/ha | kg/ha | % | ||||
| EFAW | 2004 | 3 | 3655.76 | 10962.27 | 6222.85 | 1313.87 | 3.00 | 21 |
| Efaw-Kyle 2004 | 2004 | 1 | 3579.89 | 9524.67 | 6223.19 | 1484.20 | 2.66 | 24 |
| EFAW | 2003 | 2 | 1962.65 | 10310.43 | 6231.32 | 1852.61 | 5.25 | 30 |
| EFAW | 2003 | 1 | 635.24 | 15118.78 | 6479.62 | 2240.93 | 23.80 | 35 |
| EFAW | 2003 | 3 | 2061.88 | 15678.72 | 6589.05 | 2364.50 | 7.60 | 36 |
| EFAW | 2003 | 4 | 1536.23 | 13176.94 | 6954.43 | 2509.29 | 8.58 | 36 |
| EFAW | 2004 | 1 | 1481.81 | 19129.25 | 8758.57 | 2920.29 | 12.91 | 33 |
| EFAW | 2004 | 2 | 665.83 | 19062.03 | 8942.83 | 2649.43 | 28.63 | 30 |
| >100 bu/ac | ||||||||
| Average (kg/ha) | 1947.41 | 14120.39 | 7050.23 | 2166.89 | 11.55 | 30.53 | ||
| Average (bu/ac) | 31.05 | 225.13 | 112.41 | 34.55 | ||||
| transect length: 15-23m | ||||||||
| IOWA, NEBRASKA | ||||||||
| Location | Year | Row # | Min Yield | Max Yield | Mean Yield | Std Dev | Max/Min | CV |
| kg/ha | kg/ha | kg/ha | kg/ha | % | ||||
| Shelton, Nebraska | 2004 | 1 | 2186.02 | 23474.88 | 9965.95 | 4113.82 | 10.74 | 41 |
| Shelton, Nebraska | 2004 | 2 | 755.04 | 20801.35 | 5725.80 | 3813.87 | 27.55 | 67 |
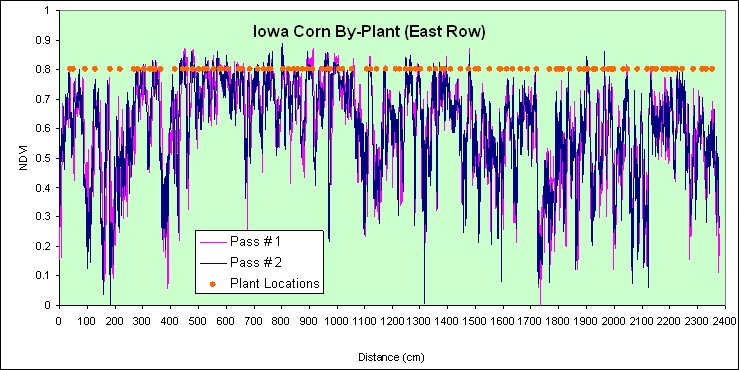
| Ames, Iowa | 2004 | East | 2099.26 | 22336.35 | 8832.30 | 3523.17 | 10.64 | 40 |
| Ames, Iowa | 2004 | West | 2448.98 | 18081.40 | 8757.68 | 3187.54 | 7.38 | 36 |
| Average: | 1872.33 | 21173.49 | 8320.43 | 3659.60 | 14.08 | 46.04 | ||
| Average (bu/ac) | 29.85 | 337.59 | 132.66 | 58.35 | ||||
| removing the 2nd row which doesn't count | 35.79 | 339.57 | 146.45 | 57.53 | 9.59 | |||
| transect length: 2 rows, 6.1 m (20ft) = 12.2 m | ||||||||
| NEBRASKA, Phillips | ||||||||
| Location | Year | Row # | Min Yield | Max Yield | Mean Yield | Std Dev | Max/Min | CV |
| kg/ha | kg/ha | kg/ha | kg/ha | % | ||||
| Eghball 1-2 | 2004 | 1 | 8108 | 24038 | 15233 | 3593 | 2.96 | 24 |
| Eghball 3-4 | 2004 | 3 | 5618 | 21620 | 14251 | 2337 | 3.85 | 16 |
| Eghball 5-6 | 2004 | 5 | 4978 | 19984 | 15199 | 3156 | 4.01 | 21 |
| Eghball 7-8 | 2004 | 7 | 7325 | 21478 | 13931 | 3309 | 2.93 | 24 |
| Eghball 9-10 | 2004 | 9 | 9459 | 20340 | 13300 | 2237 | 2.15 | 17 |
| Average: | 7097.55 | 21492.00 | 14382.80 | 2926.40 | 3.18 | 20.26 | ||
| Average (bu/ac) | 113.16 | 342.67 | 229.32 | 46.66 | ||||
| transect length: 27m | ||||||||
| MEXICO | ||||||||
| Location | Year | Row # | Min Yield | Max Yield | Mean Yield | Std Dev | Max/Min | CV |
| El Batan 2001 | 1 | 251 | 8709 | 4355 | 2206 | 35 | 51 | |
| El Batan 2001 | 2 | 1128 | 8897 | 4306 | 1759 | 8 | 41 | |
| El Batan 2001 | 3 | 439 | 10714 | 4142 | 1841 | 24 | 44 | |
| Average: | 605.68 | 9440.27 | 4267.79 | 1935.31 | 22.36 | 45.32 | ||
| Average (bu/ac) | 9.66 | 150.51 | 68.05 | 30.86 | ||||
| transect length: 7m | ||||||||
| ARGENTINA | ||||||||
| Location | Year | Row # | Min Yield | Max Yield | Mean Yield | Std Dev | Max/Min | CV |
| Argentina 1,4,5 | 1114.3 | 45650.8 | 13609.0 | 6417.4 | 41.0 | 47.2 | ||
| Argentina 12, 13, 14 | 1041.5 | 31758.2 | 10870.6 | 4505.6 | 30.5 | 41.4 | ||
| Argentina, 16, 17, 20 | 1248.7 | 25127.4 | 9151.2 | 4133.8 | 20.1 | 45.2 | ||
| Argentina 21, 22, 25 | 1934.1 | 19790.5 | 10848.4 | 3738.6 | 10.2 | 34.5 | ||
| Argentina 27, 29, 30 | 4363.6 | 20352.9 | 9912.5 | 3107.7 | 4.7 | 31.4 | ||
| Argentina 31, 33, 35 | 5639.8 | 35523.8 | 14061.2 | 4465.7 | 6.3 | 31.8 | ||
| Argentina 41, 42, 43 | 2670.1 | 14238.1 | 8111.7 | 2911.0 | 5.3 | 35.9 | ||
| Argentina 46, 49, 50 | 3064.0 | 25873.0 | 13139.0 | 3779.7 | 8.4 | 28.8 | ||
| Argentina 56, 57, 60 | 4175.1 | 34211.2 | 13594.1 | 4842.3 | 8.2 | 35.6 | ||
| Average: | 2805.69 | 28058.44 | 11477.51 | 4211.29 | 14.97 | 36.85 | ||
| Average (bu/ac) | 44.73 | 447.36 | 183.00 | 67.14 | ||||
| transect length: 8.1m | ||||||||
| OHIO | ||||||||
| Location | Year | Row # | Min Yield | Max Yield | Mean Yield | Std Dev | Max/Min | CV |
| Ohio 1 | 2066.28 | 19458.99 | 9759.43 | 4367.00 | 9.42 | 33.77 | ||
| transect length: | ||||||||
| Virginia | ||||||||
| Location | Year | Row # | Min Yield | Max Yield | Mean Yield | Std Dev | Max/Min | CV |
| Virginia | 4753.721606 | 18136.84017 | 11456.39185 | 3248.974904 | 3.815292874 | 28.35949526 | ||
| Virginia | 5072.473837 | 17949.31301 | 9986.964474 | 3189.009285 | 3.538571827 | 31.93171752 | ||
| Virginia | 7477.60728 | 24552.64197 | 13009.05038 | 3149.920877 | 3.283489097 | 24.2133037 | ||
| Virginia | 8084.244751 | 18837.44716 | 13043.08296 | 2264.365205 | 2.330143105 | 17.36065938 | ||
| AVG. | AVG. | |||||||
| All Sites (45 transects) | Min Yield | Max Yield | Mean Yield | Std Dev | Max/Min | CV | ||
| 2752.55 | 17281.01 | 8495.28 | 2765.76 | 11.06 | 34.32 | |||
| 2003 | ||||
| Maize Production | Area Harvested | Average Yield | ||
| Mt | ha | Mt/ha | bu/ac | |
| World | 638,043,432 | 142,685,295 | 4.47 | 71.3 |
| USA | 256,904,560 | 28,789,240 | 8.92 | 142.28 |
| Argentina | 15,040,000 | 2,322,857 | 6.47 | 103.23 |
| Mexico | 19,652,416 | 7,780,880 | 2.53 | 40.27 |
| Iowa | 47,869,328 | 4,858,300 | 9.85 | 157.1 |
| Nebraska | 28,564,065 | 3,117,409 | 9.16 | 146.09 |
| Ohio | 10,835,086 | 1,242,914 | 8.72 | 139.03 |
| Oklahoma | 603,448 | 76,923 | 7.84 | 125.08 |
Average corn grain yields plotted by plant, every 2 plants, every 3 plants and every 4 plants, Ames, IA 2004.
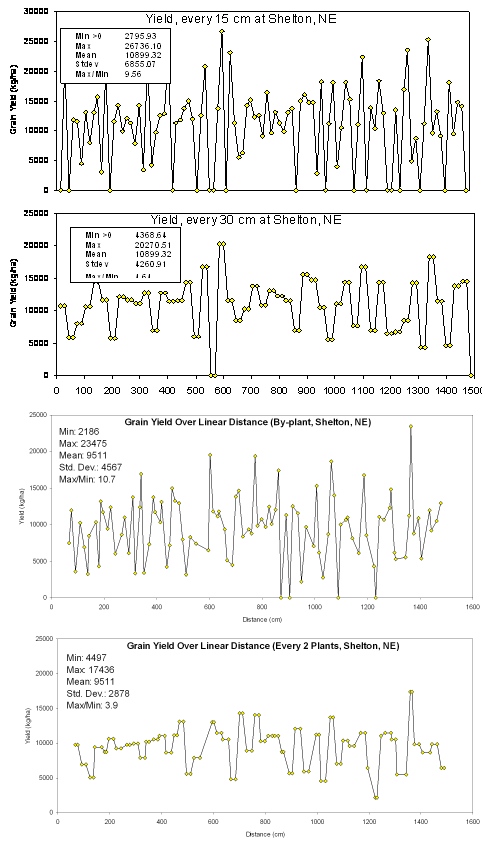
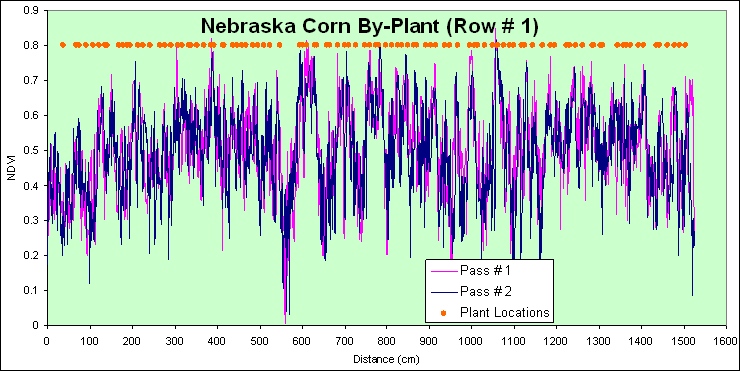
Corn grain yields plotted over fixed
distances (15-30 cm) and every 1 and 2 plants using actual distances,
Shelton, NE 2004
Min: 635 kg/ha
Max: 15118 kg/ha
Mean: 6479 kg/ha
Std. Dev: 2240 kg/ha (35.7 bu/ac)
Max/Min: 23.8X
Min: 1962 kg/ha
Max: 10310 kg/ha
Mean: 6231 kg/ha
Std. Dev: 1852 kg/ha
Max/Min: 5.25X
Min: 2061
Max: 15678
Mean: 6589
Std. Dev: 2364
Max/Min: 7.60X
Min: 1536
Max: 13176
Mean: 6954
Std. Dev: 2509
Max/Min: 8.57X
Min: 711
Max: 6680
Mean: 3448
Std. Dev: 1483
Max/Min: 9.38X
Min: 1126
Max: 10940
Mean: 4539
Std. Dev: 2316
Max/Min: 9.71X
Min: 1481
Max: 19129
Mean: 8758
Std. Dev: 2920
Max/Min: 12.91X
Min: 665
Max: 19062
Mean: 8942
Std. Dev: 2649
Max/Min: 28.63X
Min: 3655
Max: 10962
Mean: 6222
Std. Dev: 1313
Max/Min: 3.00
Min: 2157
Max: 10146
Mean: 5806
Std. Dev: 1576
Max/Min: 4.70X
Min: 2186
Max: 23474
Mean: 9965
Std. Dev: 4113
Max/Min: 10.73X
Min: 755
Max: 20801
Mean: 5725
Std. Dev: 3813
Max/Min: 27.55X
Min: 2099
Max: 22336
Mean: 8832
Std. Dev: 3523
Max/Min: 10.64X
min: 2066.282328
max: 19458.98923
mean: 9759.432918
stdev: 3296.134618
max/min: 9.417391304
cv: 33.77
Min: 2448
Max: 18081
Mean: 8757
Std. Dev: 3187
Max/Min: 7.38X
Min: 471
Max: 11213
Mean: 5783
Std. Dev: 2466
Max/Min: 23.79X
Min: 1472
Max: 12824
Mean: 5847
Std. Dev: 2631
Max/Min: 8.71X
Min: 548
Max: 10190
Mean: 4854
Std. Dev: 1537
Max/Min: 18.57X
Min: 1293
Max: 8583
Mean: 4093
Std. Dev: 1484
Max/Min: 6.63X
Min: 1094
Max: 9069
Mean: 4360
Std. Dev: 1419
Max/Min: 8.28X
Min: 1926
Max: 8810
Mean: 5059
Std. Dev: 1365
Max/Min: 4.57X
Min: 1399
Max: 8871
Mean: 4678
Std. Dev: 1587
Max/Min: 6.34X
Min: 651
Max: 8140
Mean: 4631
Std. Dev: 1850
Max/Min: 12.49X
Min: 684
Max: 4556
Mean: 2725
Std. Dev: 972
Max/Min: 6.65
Min: 3579
Max 9524
Mean: 6223
Std. Dev 1484
Max/Min: 2.66

By-plant-yield (entire plants, stalk+ear harvested at the base) over 6 m of row, and corresponding NDVI sensor readings collected from this exact same area at the 7 leaf and 10 leaf growth stages, 87 and 70 days earlier, Texcoco, Mexico, 2002. Variation in yield over 8 meter of row was 0.01 to 0.41 (>10X)
By-plant yields, El Batan, Mexico, 2002, over 25 m of row (range 0.03 to 0.42) (Row #4) CIMMYT Corn hybrid CMS-939083
_files/spad.jpg)
Shelton, NE, MSEA Site, USDA-ARS 2004. Work by Paul Hodgen, Kent Martin, and Kyle Freeman has shown that SPAD readings taken "by-plant" at V16 were highly correlated with final "by-plant" grain yields. This relationship would not have been observed unless the by-plant resolution had been used.
Reproducibility of NDVI readings over 16m using an on-board shaft encoder, with 50 corn plants sensed at the 7-leaf growth stage on May 23, 2003, Perkins, OK.