Corn
Producers: Why do you apply more N than needed?
Corn
Producers: Why do you apply more N than needed?The SBNRC works, but you have to understand why
Sensor Based
Nitrogen Rate Calculator, on-line since 2002
The SBNRC works, and works well for corn, but it comes with background information that has to be applied first.
Location Situation Recommendation (on-farm experiences with corn producers)
FACT: N responsiveness (RI) is independent of yield level or yield potential (YP0)
This is an important component of accepted N theory (refereed publications), especially when making N recommendations in corn. Why? As you will note in the "Location Situation Recommendation" document, we are well aware of sites where we see no evidence of N responsiveness by V8, or even V12, but where we have recommended added fertilizer N. Crucial variable here was knowing that even though the RI was 1.0, the predicted yield potential was high (in one case > 300 bu/ac). So what did we do? We relied on knowledge that RI and YPO are independent of one another (see Figures 1, 2, 3 in the "Independence YPO and RI" document). Knowing this, we knew that there was likely going to be a demand for N, especially late that we wouldn't be able to see at lower yield potentials. So what happens? The High estimated Yield Potential has to take over. The SBNRC works and works well, but it isn't an agronomist. It is a reflection of a mathematical algorithm. Also, with corn, 110 days doesn't give us a lot of time to make accurate mid-season N recommendations that make sense at 50 days (see differences in total N uptake and stage for corn and wheat http://nue.okstate.edu/Nitrogen_Uptake.htm) With wheat we have 220 days and can make solid decisions at 100 days on the need or lack thereof for added N, especially in light of how much N is in the crop by the end of February.
Some field
experiences necessary to accurately and reliably use the SBNRC in corn
follow.
OSU corn N recommendations even when RI's are 1.0, are to apply a minimum of 50 lbs N/ac. Putting out a minimum of 50 lbs N/ac has its roots in former OSU PhD students, that are now faculty members at Virginia Tech. They realized that some of the uncertainty in knowing whether or not there would be a late demand for N had to be compensated by putting down a minimum sidedress amount.
The uncertainty of knowing
whether RI or YP0 (or both) will dictate demand for fertilizer N is where
OSU has been more progressive.
At planting, the proportionate influence of RI
and YP0 is unknown. But, by V10, both can be
predicted. Using the OSU algorithm (YP0*RI=YPN), we recognize that
it will be a product of both (most of the data in the RI-Yield
graphs, Figures 2,3,4 is in the middle).
This is precisely why we estimate both
"independently."
 N
rich Strip brochure (basic recommendations)
N
rich Strip brochure (basic recommendations)
Examples: RI=1.0, YP0=300+ bu/ac. SBNRC = 0. Recommendation: Apply a minimum of 50 lbs N/ac topdress. Why? Recognizing the high yield potential is critical. AT this level, the demand for late-season N is going to be an issue. Conservative N application mid-season could be considered as insurance.
RI = 3.0,
YP0=140 bu/ac. SBNRC = 220 lbs N/ac. The predicted demand for
fertilizer N could realistically approach 220 lbs N/ac as predicted by the
calculator. But if yield potentials are only projected to be 140 bu/ac,
early season stress (could be moisture, weed pressure, or something else)
will restrict demand for N later in the season. Applying less than
the amount predicted by the calculator is in orde.r
The SBNRC projects how much N should be applied at a predicted yield level and estimated N responsiveness. But it is not an agronomist. It cannot see a field with perfectly homogenous plant stands (indicator of higher yield potential), and it cannot see uneven plant spacing and weed competition (indicator of lower yield potential). These are basic agronomic issues that our eyes can integrate into one applied value, but sensors cannot. The final decision concerning what N rate should be applied, especially in corn, has to reside with the agronomist who integrates all known information (planting conditions, rainfall received, insect damage, weed pressure, emergence homogeneity, plant stand heterogeneity, water stress, demand for irrigation, other nutrient deficiencies and/or potential toxicities, soil pH, etc.) into one collective value. Will it pay to apply the N rate recommended by the SBNRC, or should apply more? This is an on-site, by location, by situation decision that has to be made by the agronomist and/or producer.
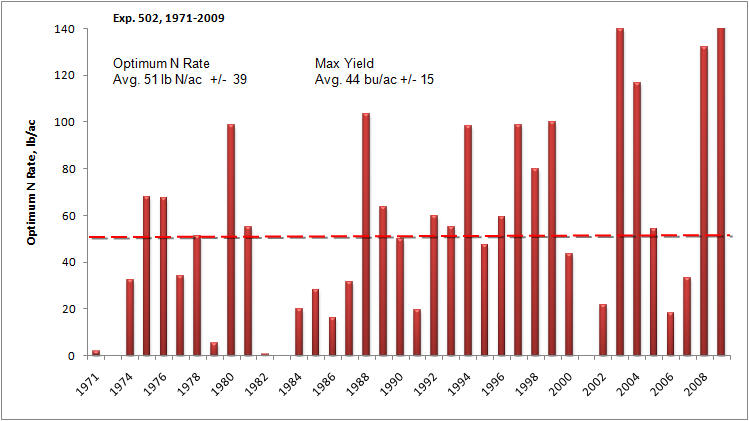
But, with the right information, NDVI values, and environmental conditions, the SBNRC is a much better choice than what producers are doing today, which is basically applying N based on averages. Look no further than Figures 1-9 on whether this is a good choice. Yield levels that vary wildly from year to year, and N responsiveness that changes by year will convince any farmer that the average N rate is not a wise choice.
For long-term RC-RS corn experiment near Mead, NE, and winter wheat experiment 502, near Lahoma, OK, the optimum N rate has significantly fluctuated (20 to 180 lbs N/ac and 0 to 120 lbs N/ac for corn and wheat, respectively) The need to move away from using averages is self evident.