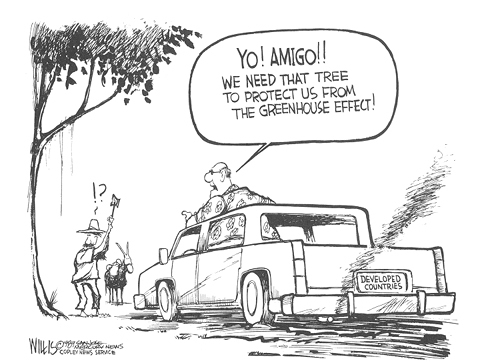
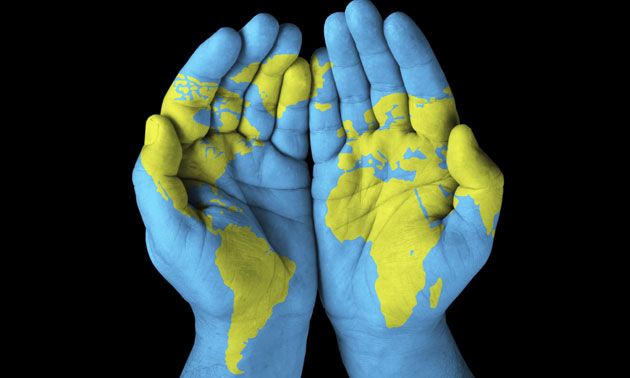
Our Environment, CO2, and World Awareness


Soil Plant Nutrient Cycling and Environmental Quality
hunger, malnutrition, disease, epidemic
Global Warming Bumper Stickers

NASA, Global Warming (current CO2 level)
We do not have a "companion earth" to test this against.
We have to get it right the first time.
Peter Omara Abstract
NASA, Scientific Consensus
NASA, Popular Articles
Green Revolution
LIVE SITE: Atmospheric CO2 Orbiting Carbon Observatory
 2016
410,
May 2019
411, June 2019
412, February 2020
2016
410,
May 2019
411, June 2019
412, February 2020413, March 2020 414, July 2020 415, January 2021
What HAS OSU Published?
1. Estimated Increase in Atmospheric Carbon Dioxide Due to worldwide decrease in Soil Organic Matter
2. Estimated land area increase of agricultural ecosystems to sequester excess atmospheric carbon dioxide. Commun. Soil Sci. Plant Anal. 32:1803-1812. (pdf)
This is nothing more than a Math Problem (Kevin Raun, August 17, 2017)


BIOFase (Mexico)
Day with no CARS, Bogota Colombia 2016
Day with no CARs, 2019
How Meat Contributes to Global Warming
February 2009 | By Nathan Fiala
Scientific
American, February 2009
FAO report found that current production levels of
meat contribute between 14 and 22 percent of the 36 billion tons of
"CO2-equivalent" greenhouse gases the world produces every year.
Half a pound of hamburger for someone's lunch, a
patty of meat the size of two decks of cards releases as much greenhouse
gas into the atmosphere as driving a 3,000-pound car nearly 10 miles.
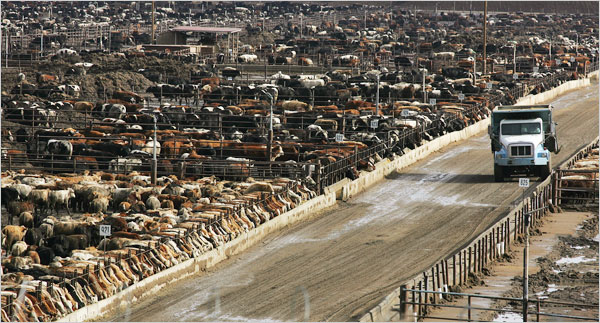
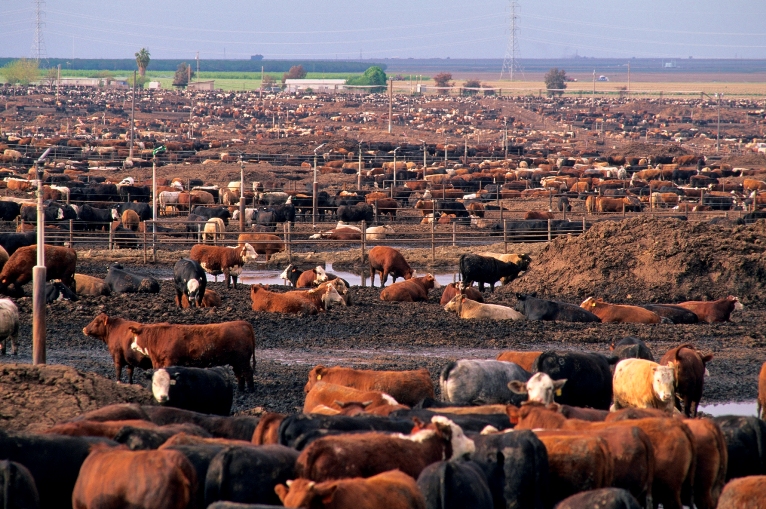
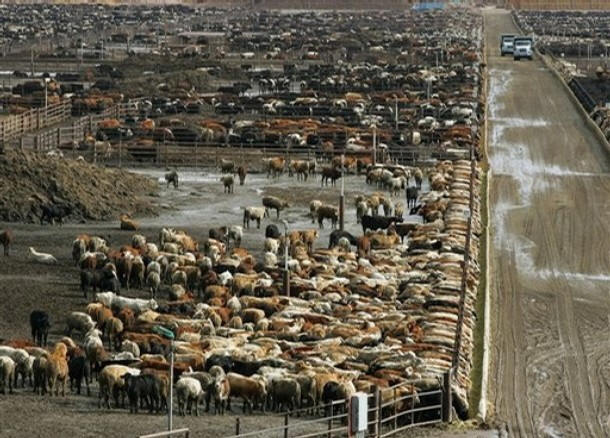
The USA produces and consumes the most beef in the world. This livestock farming brings together the Western regions of the United States specialized in reproduction and the great plains of the Midwest fattening regions where corn and soybeans are produced and where livestock farms called feedlots have been developed. The number of cattle herds in the world is now over one billion. Livestock farming has a disastrous effect on the environment and contributes to global warming more than the transport sector. This activity causes 65% of the hemioxide nitrate emissions, a gas which has 296 times more global warming potential than CO2, mainly because of manure. It also produces 37% methane emissions. Methane has 23 times more global warming potential than CO2. The 9% of carbon dioxide emissions are linked to human activities. But all around the world, the increase in standard of living comes with higher meat and dairy product consumption. World meat production should still increase 64% by 2050, going from 296 to 465 million tons.
1. Where Global Emissions are Coming From? (can change map view by changing the year at the bottom)
 2. Livestock
damages the environment. It accounts for between 8% and 18% of
greenhouse-gas emissions
2. Livestock
damages the environment. It accounts for between 8% and 18% of
greenhouse-gas emissions
As CO2 levels climb, millions at risk of nutritional deficiencies (Phys.Org)
 Supply of food under threat due to biodiversity loss across the globe: UN
report
Supply of food under threat due to biodiversity loss across the globe: UN
report
2019
Climate Change is Accelerating
USE of Cement to Allerviate Global Warming
Washington Post (12/10/2019)
Greenland

The Ocean's Carbon Balance
National Geographic: The Great Pacific
Dalton Sims (see estimates)
World Population not consuming animal products
a.
Global Farm Animal Production and Global Warming: Impacting and Mitigating Climate Change b. Livestock Methane Emissionsc. Statistics from the Beef Industry
(www.beefusa.org)
90,000,000 head
d. Mitigation Options for Global Warming (Science, 1992)
e. Beef population by country
Cancer caused by meat consumption, Washington POST, October 2015Red meat and colon cancer (Harvard Medical)
Bogota, Colombia (15th anniversary of the car-free day) Day with no Cars-2 (population 7.1 million, Mexico City population, 21.2 million)
Are the Effects of Global Warming Really that Bad?
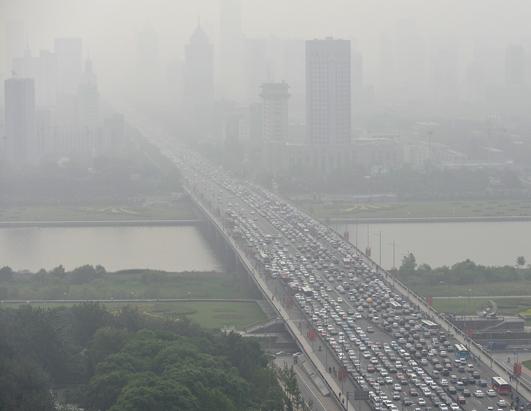
Pollution, Wuhan, China
74 Chinese Cities Ranked (Pollution)
Antibiotic Reistance/Genes coming from the Pork Industry, mBio (April 12, 2016)
Factors Contributing to Global Warming (Gwen Wehmeyer)
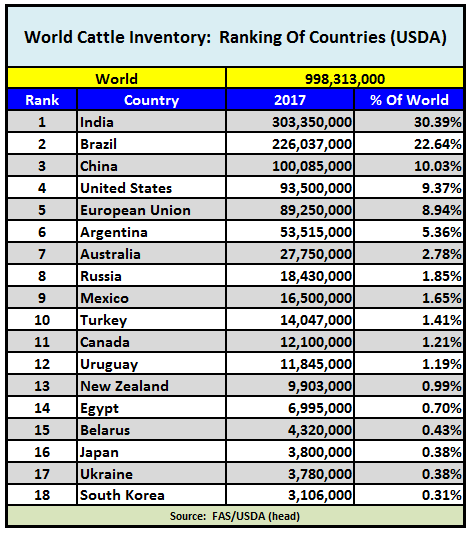 World Cattle by Country, 2017
3. The Great Pacific Garbage Patch (National Geographic)
4. Methane release from Antarctic Ice (Fox News) 2010
5. Vegetarianism to save Planet (EarthSave)
Atmospheric CO2, Wikipedia
OSU Land Area and CO2, Wright et al. (2001)
6.
CO2 emissions from 1.5 billion cattle (18% of
greenhouse gases)
Mitigation Options for Global Warming (Science, 1992)
Nitrous oxide
(30% coming from human/agricuture)
Livestock Methane Emissions
Global
Farm Animal Production and Global Warming: Impacting and Mitigating
Climate Change
8.
Aspen-FACE
__________________________
Nature:
Effects of Rising Atmospheric Concentration of CO2 on Plants
CO2,
methane, nitrous oxide emissions from cattle
9. Destiny: Microbial Ecology and increased CO2
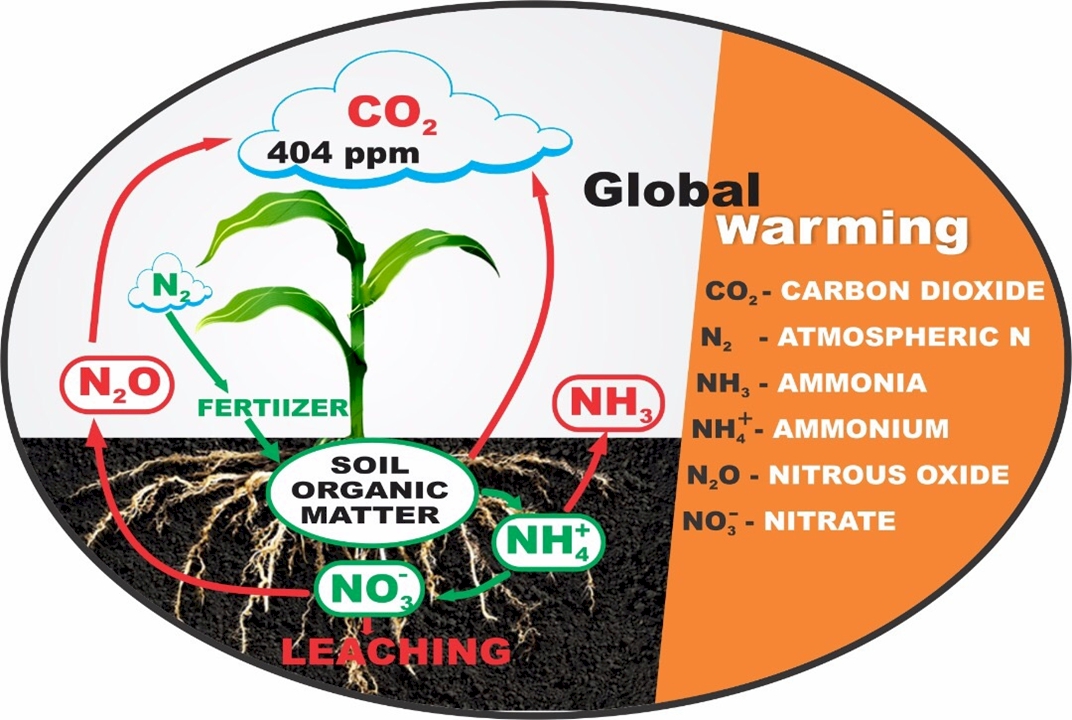
10. Global Warming and The Nitrogen Cycle
11. The NITROGEN Problem: Why Global Warming is Making it Worse (August 7, 2017) N Pollution
12. Changing Department Names from Agronomy to Plant, Crop, and Soil Sciences. 1998. J. Nat. Resour. Life Sci. Educ. 27:113 to 116. (go to the end)
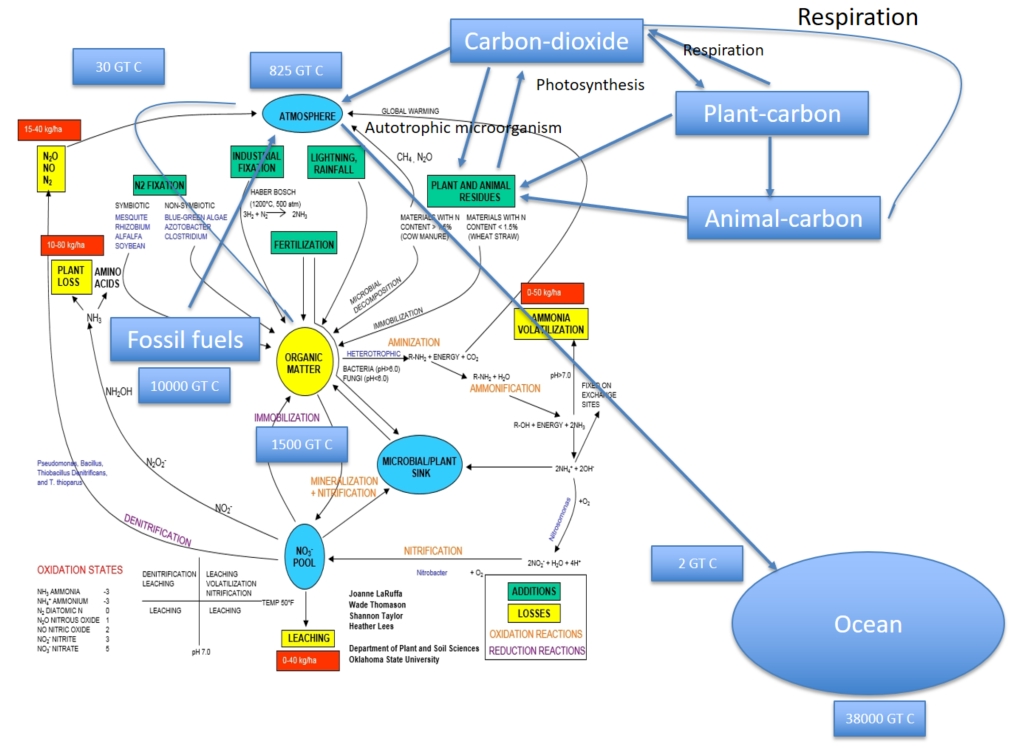 Carbon/Nitrogen Cycle, SOIL 5813
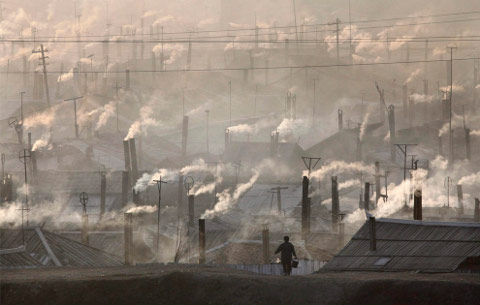
Wuhan China (http://aqicn.org/city/wuhan/)

Exxon Shareholders Approve Climate Resolution: 62% Vote for Disclosure
502 Annual average Temperature, 1993 - 2017.
data one;
input year temp;
cards;
1993 14.19
1994 13.6
1995 14.43
1996 14.21
1997 14.21
1998 14.54
1999 15.15
2000 14.82
2001 15.31
2002 14.19
2003 14.31
2004 14.71
2005 15.02
2006 15.88
2007 14.60
2008 14.18
2009 14.26
2010 14.61
2011 15.41
2012 14.98
2013 13.84
2014 14.32
2015 15.23
2016 15.88
2017 15.56
proc glm;
model year = temp;
proc glm;
model temp = year;
run;