 Corn Research
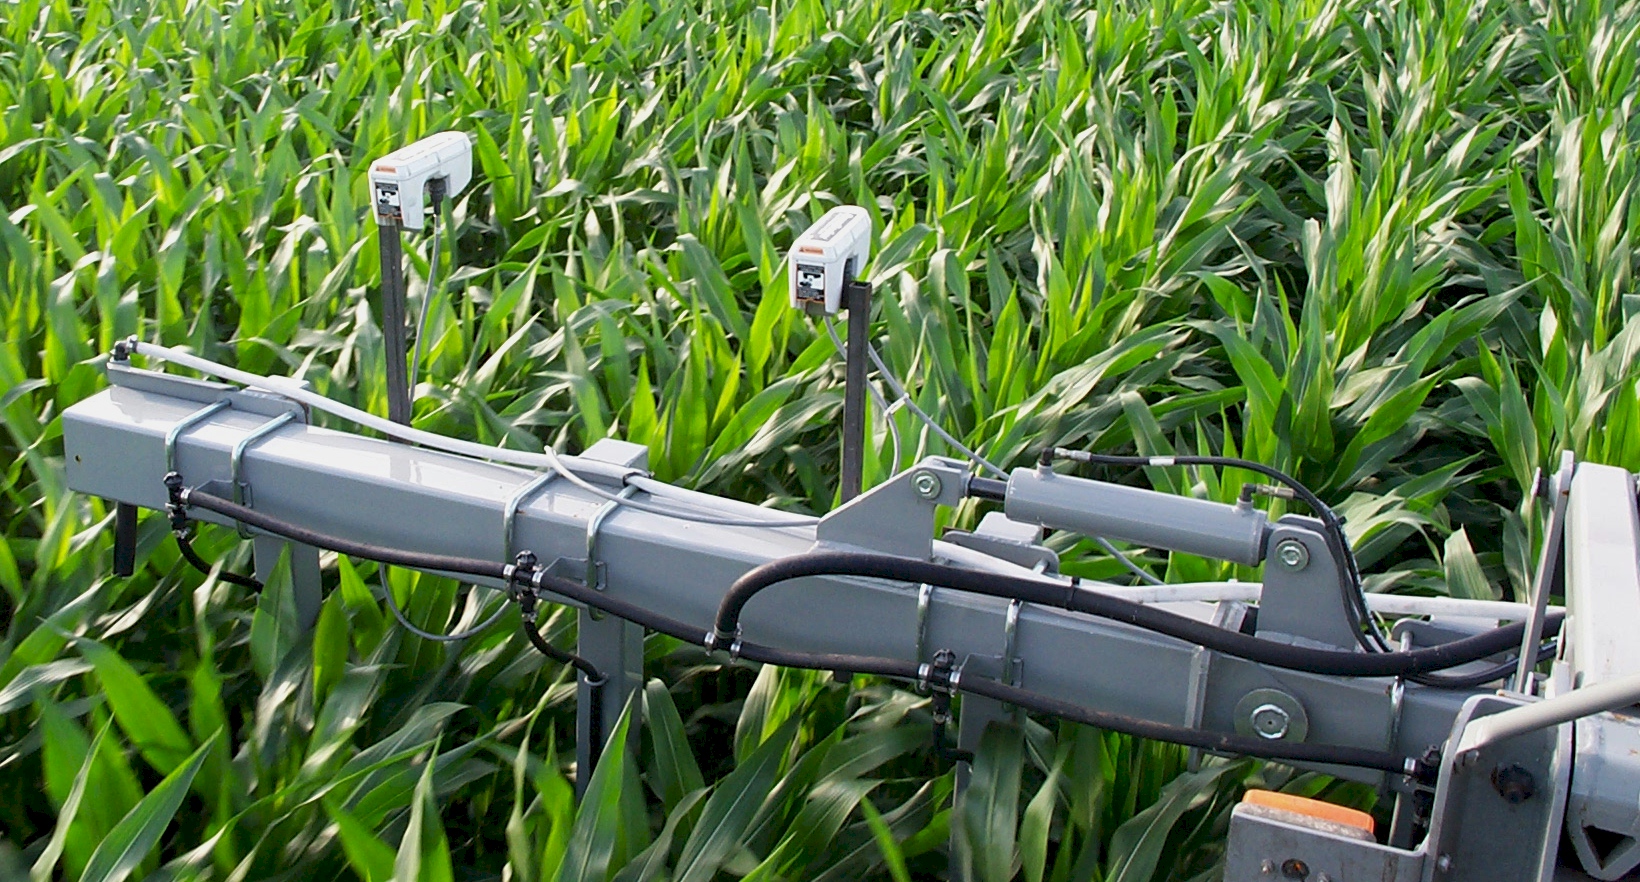
Summary: Using the maximum yield Nitrogen Fertilization Optimization Algorithm (NFOA), grain yields were increased by 4 bu/ac when compared to the 80-85 N split (treatment 10 versus 4). For treatment 10 and treatment 4, 80 lb of N /ac was applied at a fixed rate preplant. When topdress N was applied on June 17, 2003, fixed rates were applied in treatments 2, 3, and 4. Treatments 7-11 received topdress N applied using the variable N rate applicator (illustrated below) capable of sensing and treating each corn plant individually. Grain yields were increased by 4 bu/ac for treatment 10 when compared to treatment 4, using 42 less lb N/ac. As a result, the nitrogen use efficiencies of this treatment were 10% better than the split N treatment (treatment 10 vs 4, 40% NUE, and 30% NUE, respectively).
| Corn OFIT Trial, MSEA site, USDA-ARS | Planted: | |||||
| 2003 | Harvest: | |||||
| Treatment | Preplant Rate | Sidedress Rate | N Rate | Total N Rate | Grain Yield | NUE |
| 10 to 12 leaf stage | Pre+topdress | |||||
| lb N/ac | lb N/ac | lb N/ac | lb N/ac | bu/ac | % | |
| 1 | 0 | 0 | 0 | 0 | 118 | |
| 2 | 0 | 89 | 89 | 89 | 165 | 37 |
| 3 | 0 | 161 | 161 | 161 | 170 | 23 |
| 4 | 80 | 85 | 165 | 165 | 193 | 30 |
| 5 | 80 | 0 | 80 | 80 | 180 | 53 |
| 6 | 160 | 0 | 160 | 160 | 181 | 27 |
| 7 | 0 | RI-NFOA | 0+37 | 37 | 141 | 41 |
| 8 | 80 | RI-NFOA 60 % NUE | 80+25 | 105 | 177 | 41 |
| 9 | 0 | MY-NFOA | 0+64 | 69 | 165 | 42 |
| 10 | 80 | MY-NFOA | 80+43 | 123 | 197 | 40 |
| 11 | 80 | RI-NFOA 40% NUE | 80+61 | 141 | 175 | 28 |
| SED | 11 | 13 | ||||
| Replications | 4 | NDVI N Rich | 0.513 | RI = 1.2 | ||
| Soil N applied at the base of each corn plant | NDVI Check | 0.448 | ||||
RI NFOA -nitrogen fertilization optimization
algorithm (based on the response index)
MY MFOA - nitrogen fertilization optimization algorith (based on maximum
yield)
Damaged Plots (Application Error, removed from analysis & entered as
missing data) 101, 102, 103, 104, 105, 308
Harvest: September 24, 2002
| Treatment | Preplant Rate | Sidedress Rate | Total N Rate | Grain Yield | NUE | Std. Dev. |
| 8 to 12 leaf stage | ||||||
| lb N/ac | lb N/ac | lb N/ac | bu/ac | bu/ac | ||
| 1 | 0 | 0 | 0 | 107.9 | 0 | 15 |
| 2 | 0 | 70 | 70 | 118.2 | 10.3 | 21 |
| 3 | 0 | 140 | 140 | 115.1 | 3.6 | 21 |
| 4 | 70 | 70 | 140 | 128.3 | 10.2 | 15 |
| 5 | 70 | 0 | 70 | 124.1 | 16.2 | 14 |
| 6 | 140 | 0 | 140 | 123.8 | 7.95 | 10 |
| 7 | 0 | RI NFOA (23) | 23 | 105.9 | 0 | 22 |
| 8 | 70 | RI NFOA (23) | 93 | 130.6 | 17 | 15 |
| 9 | 0 | flat RI NFOA (22) | 22 | 94.3 | 0 | 33 |
| 10 | 70 | flat RI NFOA (22) | 92 | 129.1 | 16 | 6 |
*one of the check plots was lost due to harvest
error
NFOA - nitrogen fertilization optimization algorithm
(N applied to each plant)
flat NFOA - average N rate determined from
treatments 7 and 8, applied uniformly to treatments 9 and 10.
Treatment 4 topdress applied 2 weeks later.
Replications 4
Days from planting to sensing
Soil N applied at the base of each corn plant, June
11, 2002
4/29/2002
Treatment 4 (sidedress application date delayed)
6/11/2002
Border rows for treatments 7 and 8 received flat
rates (25 kg/ha)
Center 2 rows of treatments 7 and 8 were fertilized by-2-plants
Kevin Raun, Corn-Soybeans-Wheat Rotation
 IMG_1064.MOV
Figure 1. Relationship between corn by-plant dry yields and NDVI sensor measurements multiplied times plant height at 6 locations, 2003.
Can By-Plant yield levels be predicted at early stages of growth? Figures 1 and 2 suggest that this can indeed take place in corn.
Figure 2. Relationship between wet yield and by-plant NDVI sensor readings taken at V7, V8, and V10 stages in corn.
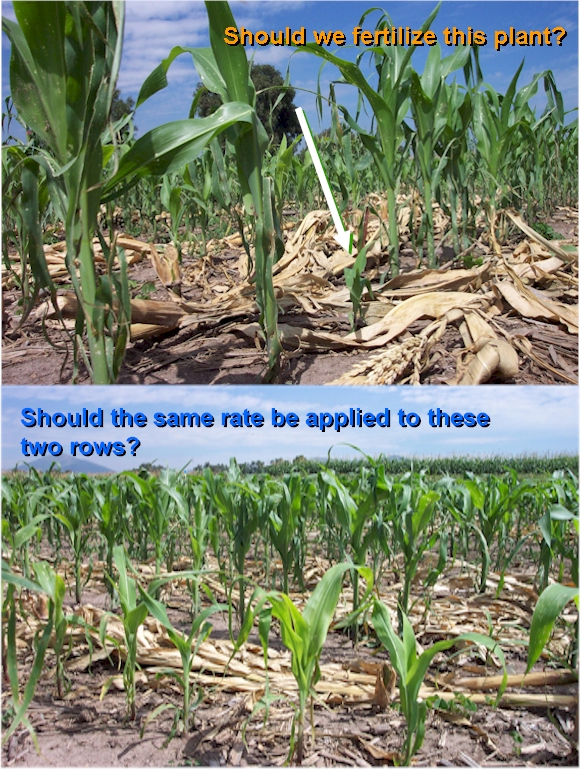
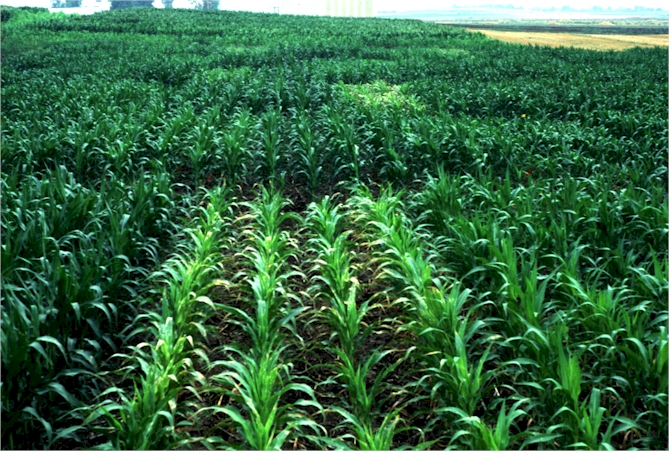
By row differences in corn color as a function of N deficiency, Mead, Nebraska
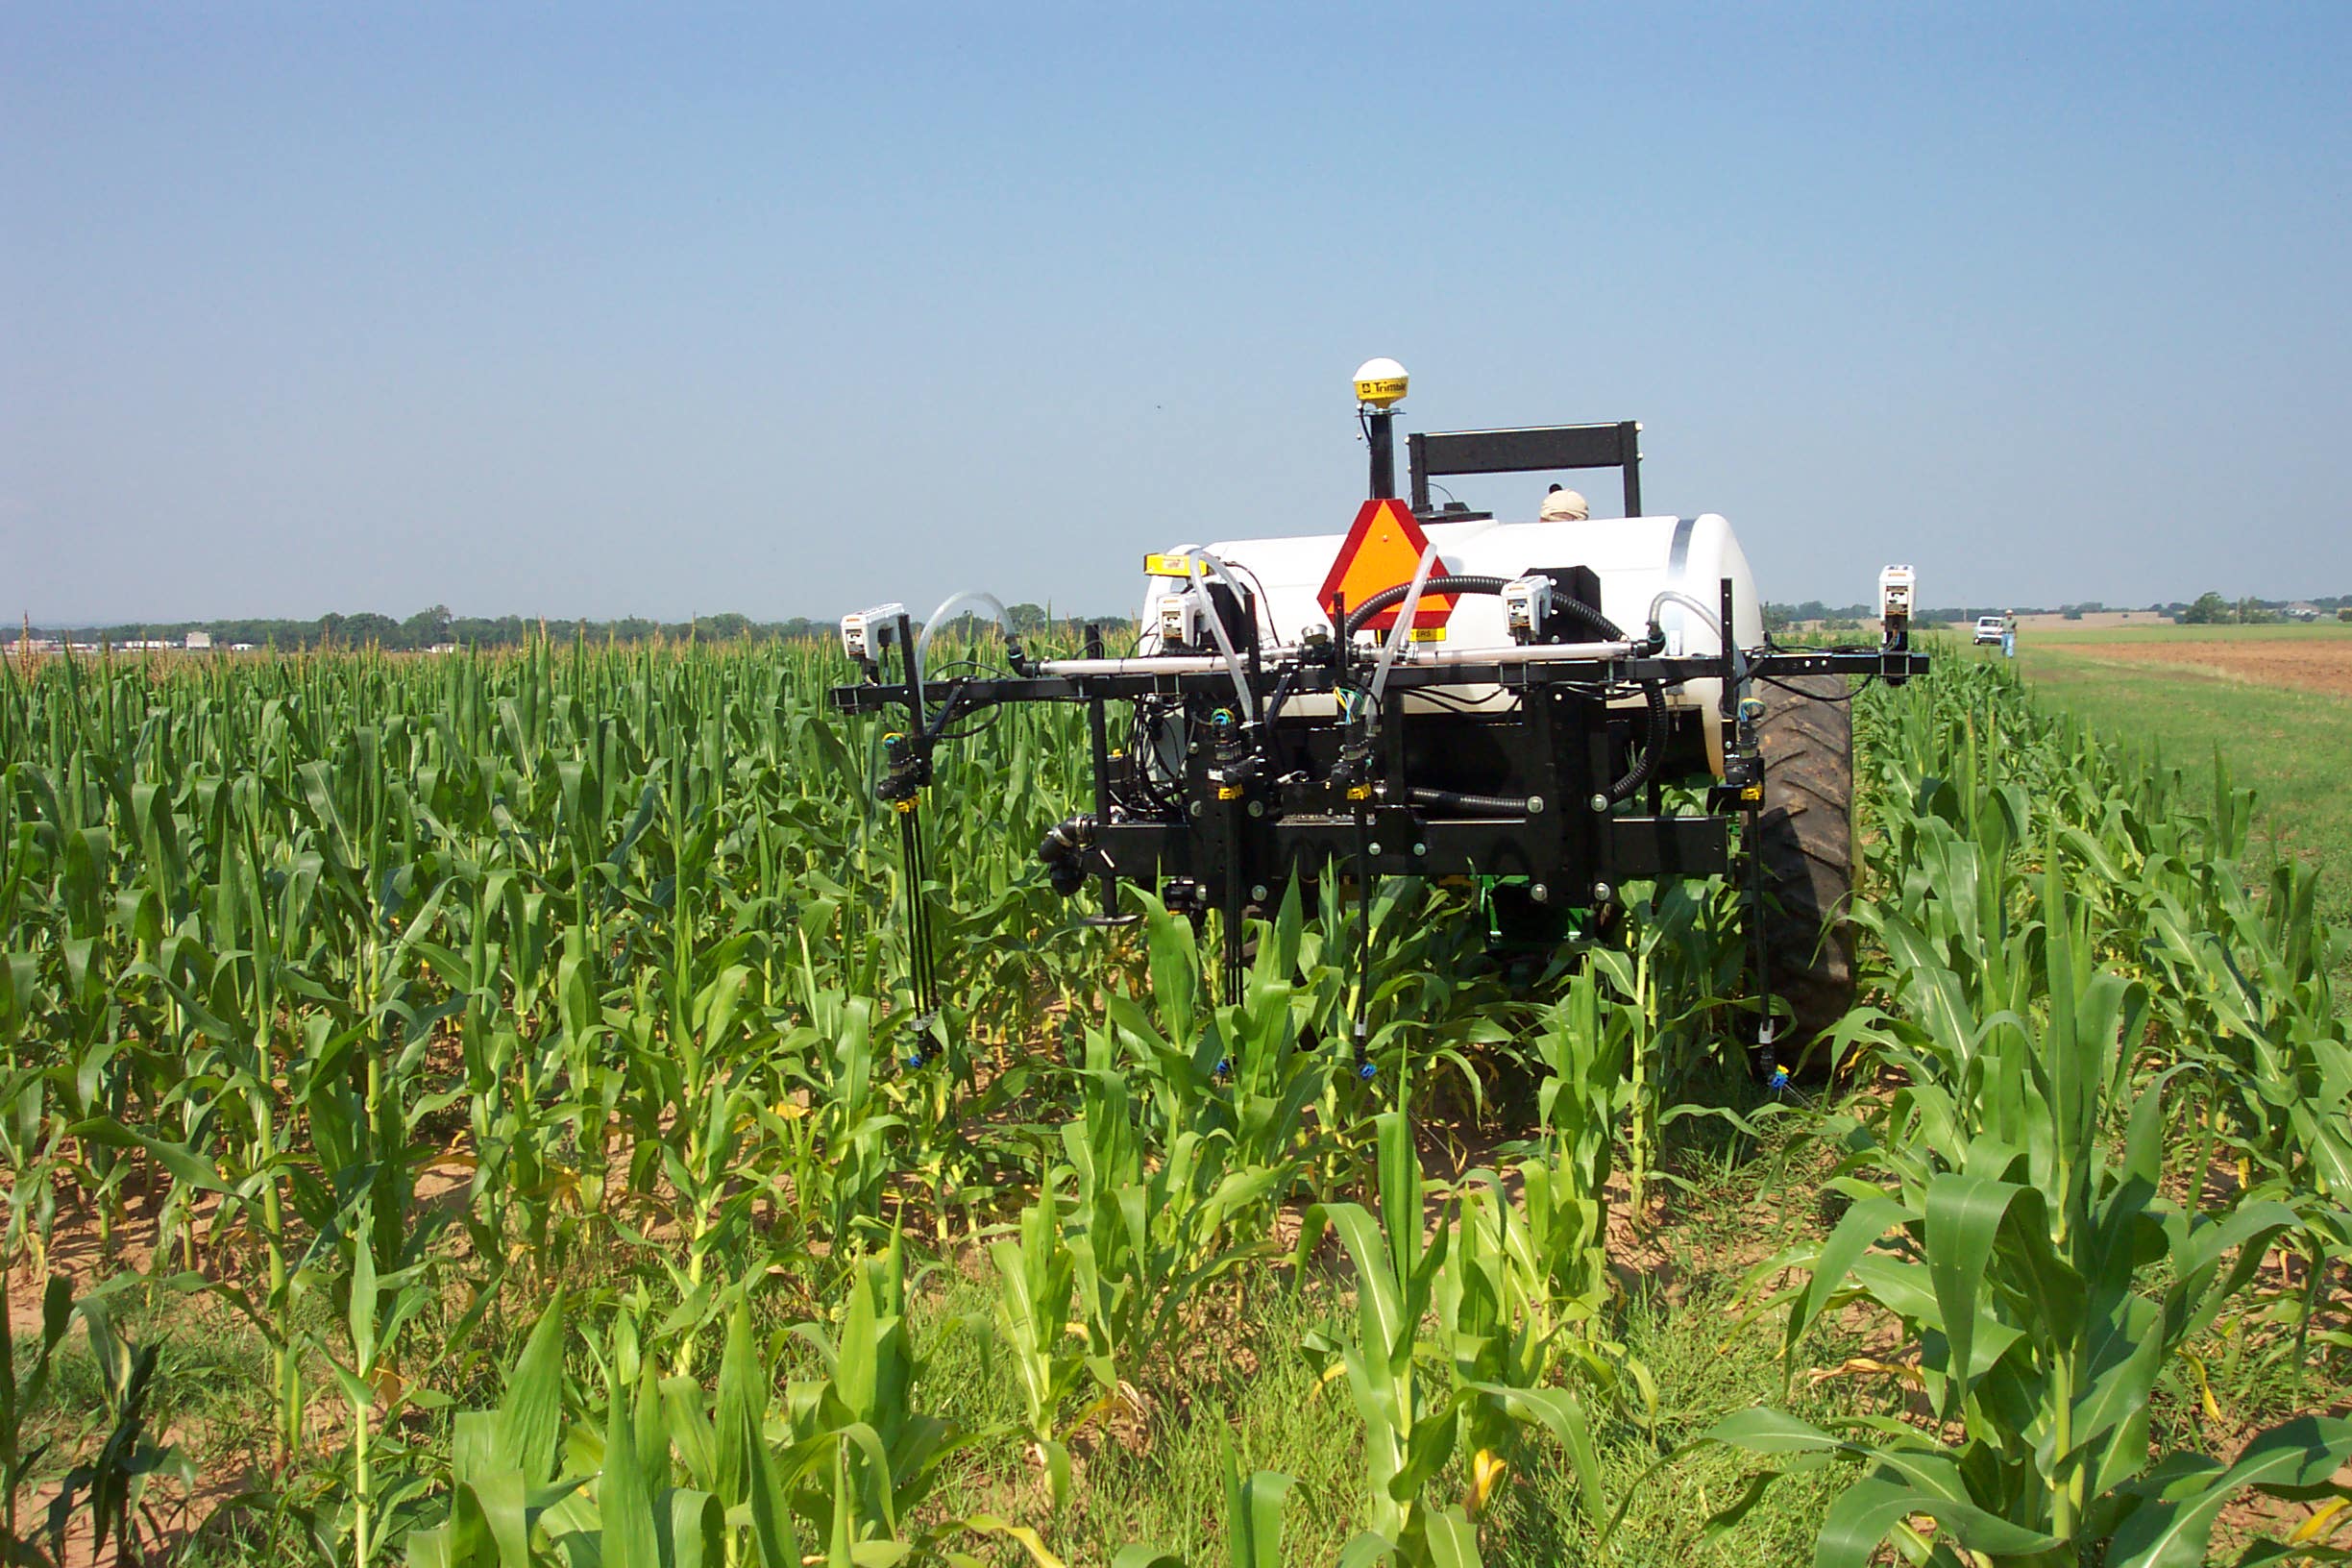
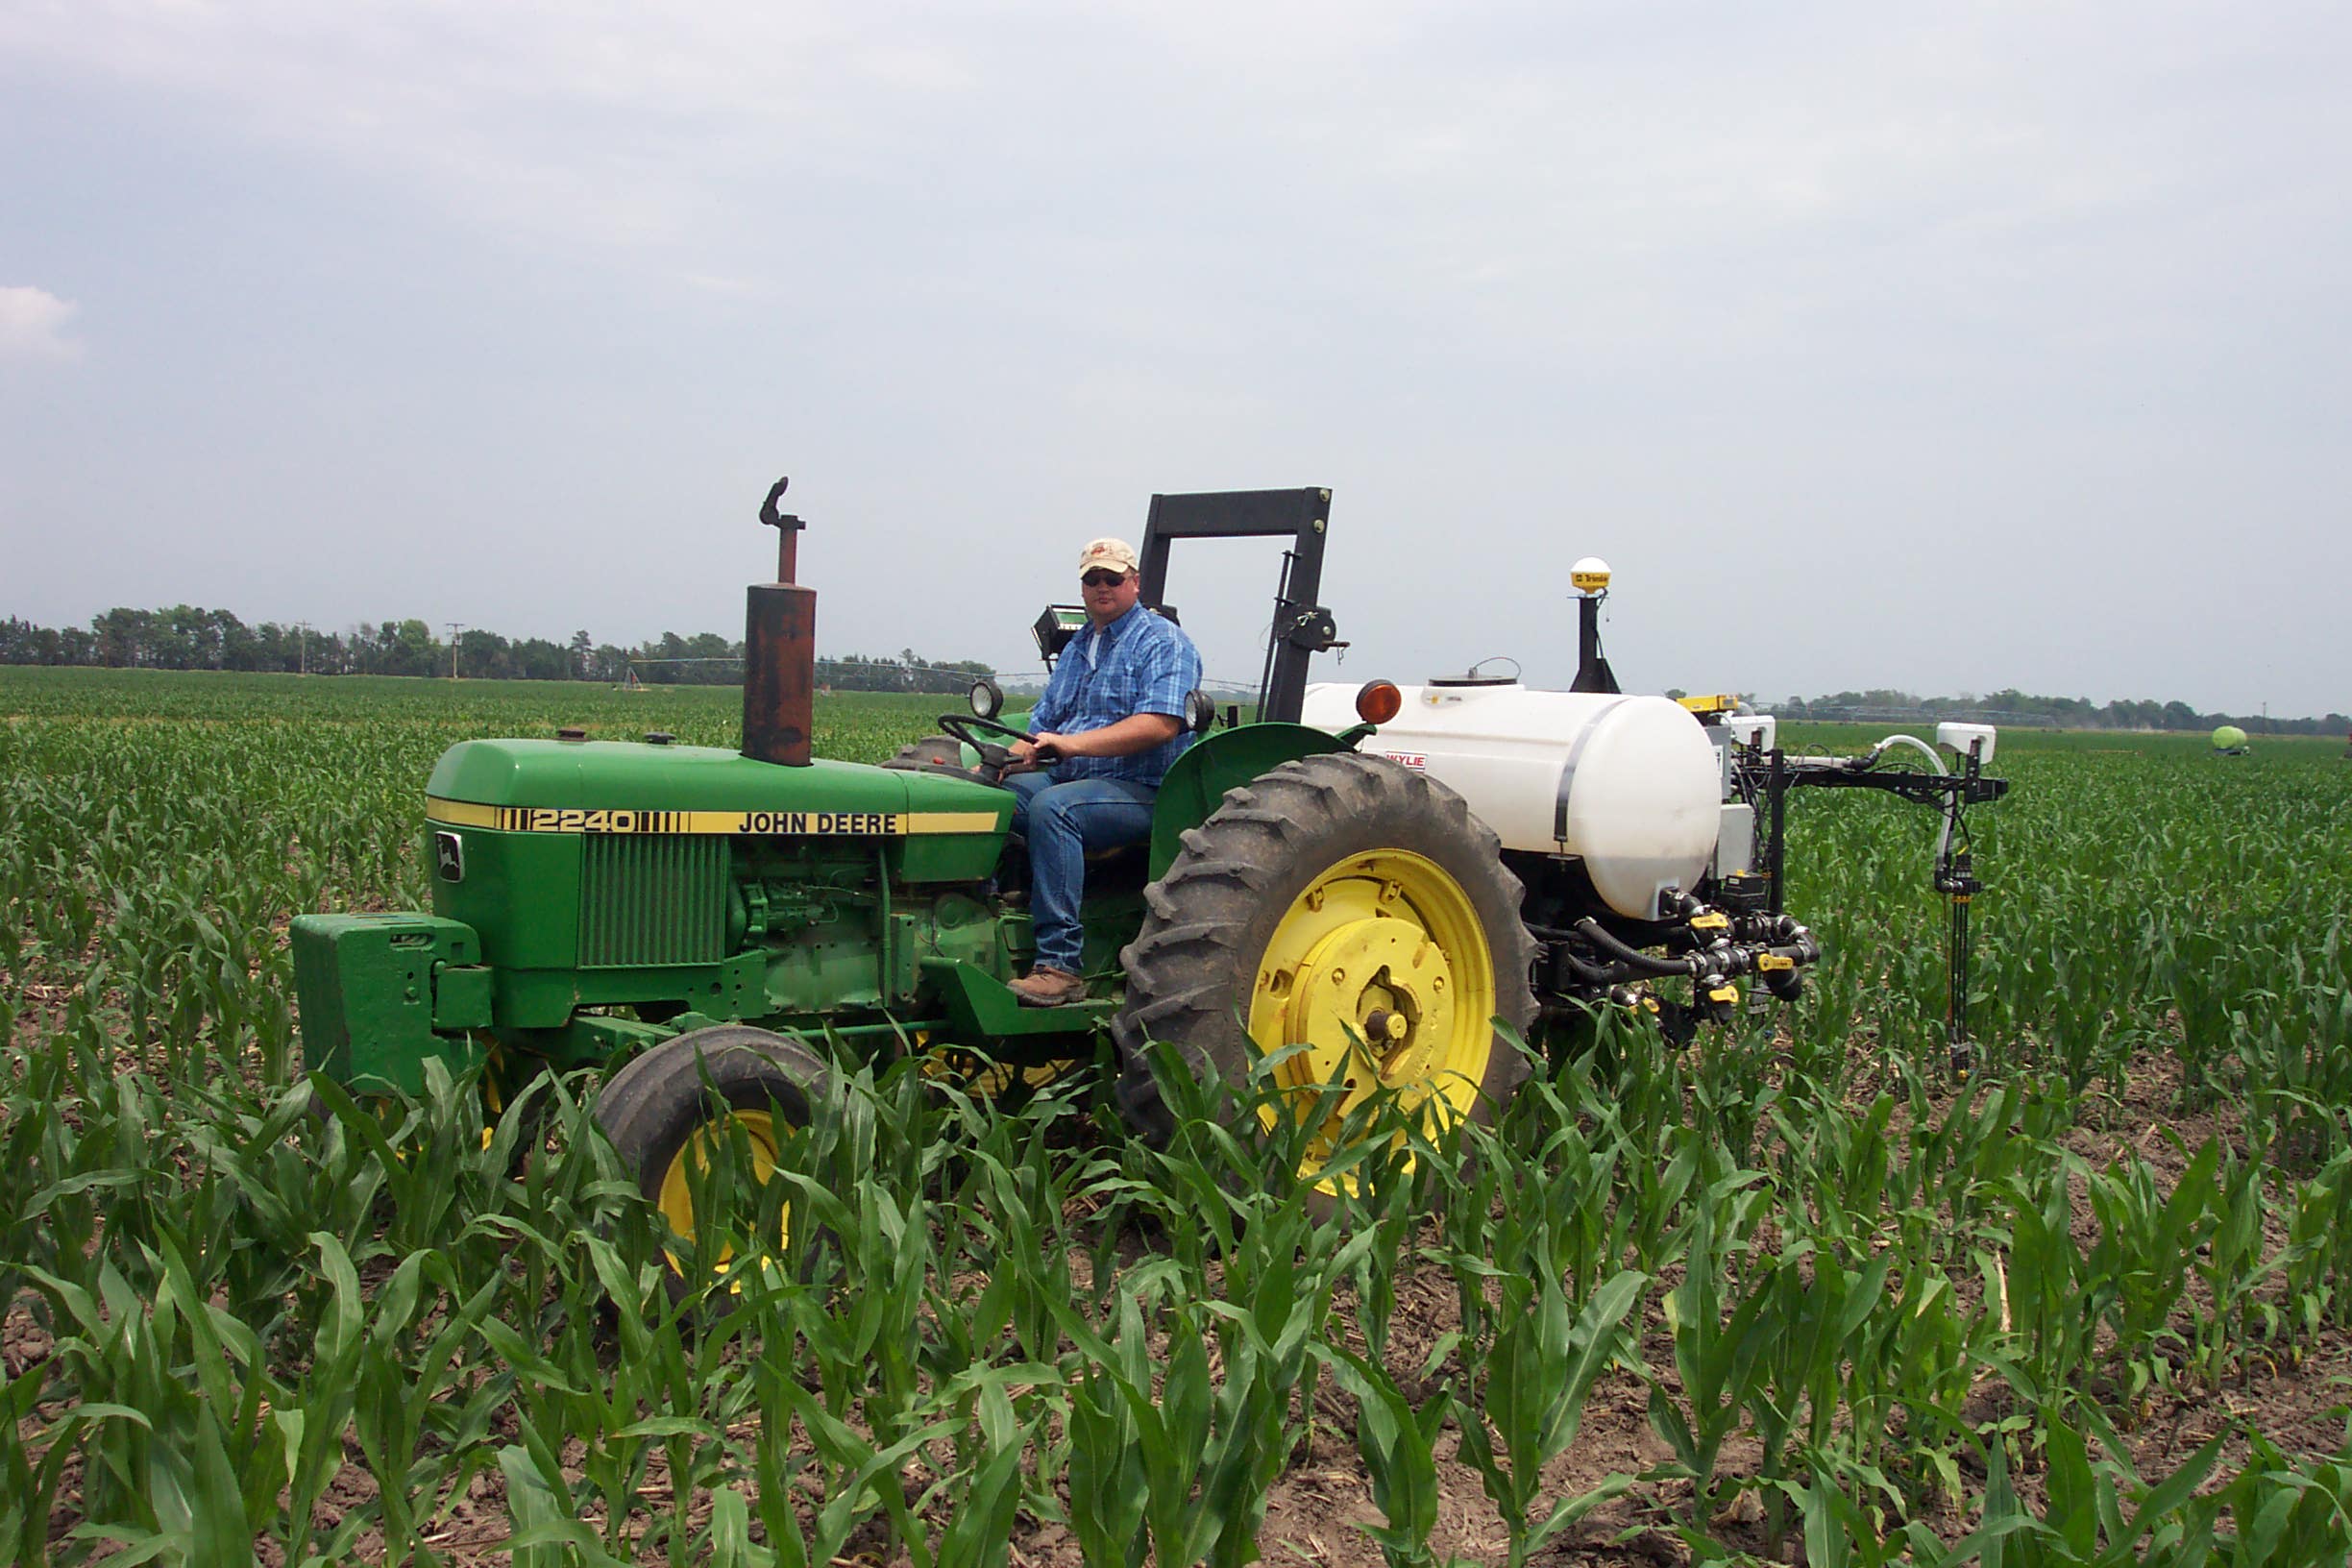
Paul Hodgen (B.S., and M.S. Oklahoma State University), and current Ph.D.
student at the University of Nebraska operates one of the variable N rate
applicators developed for corn near Shelton, NE (June 17, 2003).
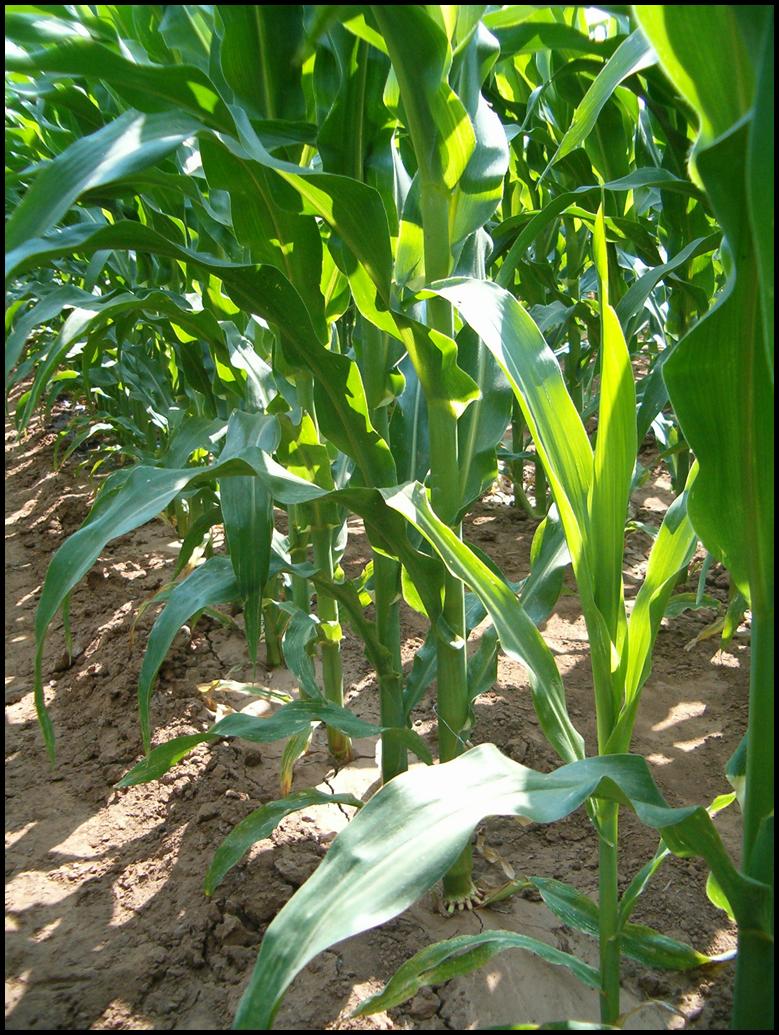
 Corn, V5, Efaw OK, 2003
Do corn roots overlap when plants are more than 7 inches apart? When corn plants were excavated from a corn field to a depth of 2 feet, few rooting cylinders overlapped, unless plants were less than 7 inches apart. Over 70% of the root mass was found to exist within a 6 inch diameter of the stalk, further supporting by-plant variable N application in corn.
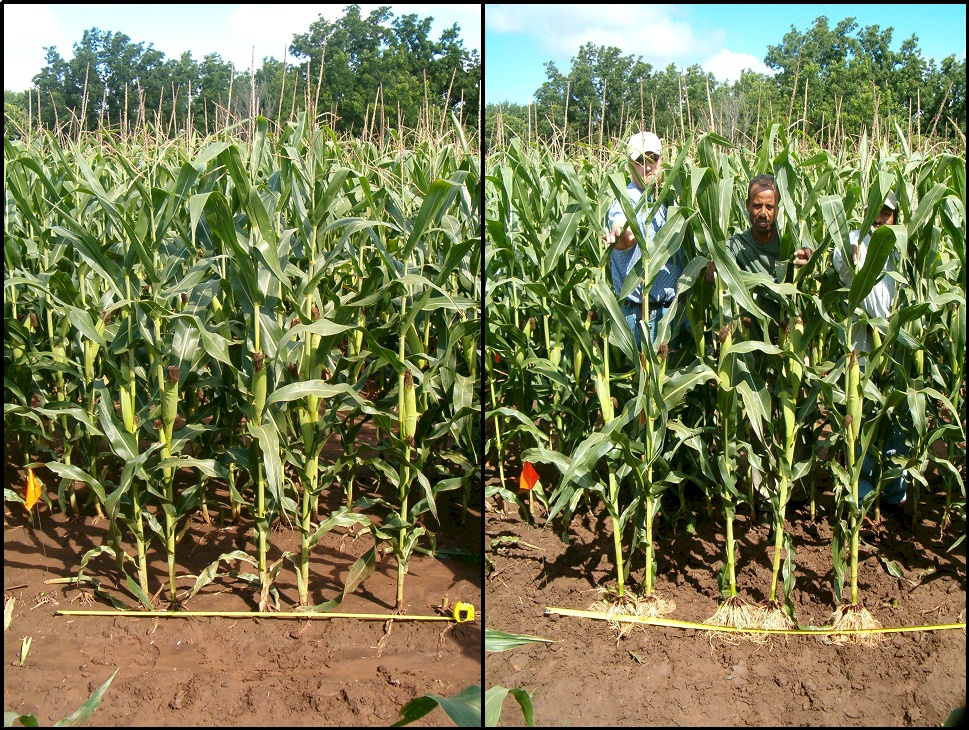
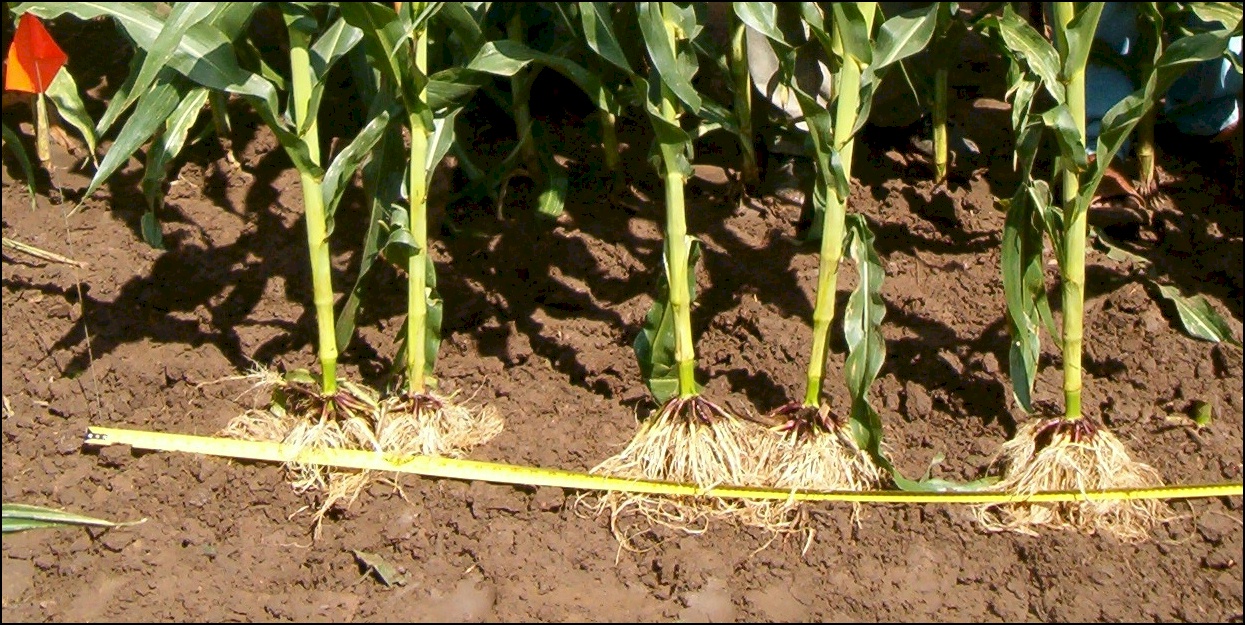
After excavation and complete root washing, corn plants were placed in the
exact same location as from the slide above. Root systems from these
plants were then thoroughly evaluated. Unless the plants were within
6 inches of each other, the 70% by-plant root mass (exists within a 6 inch
radius of the stalk) did not overlap with bordering plants. Thus
treatment of each plant or every 2 plants within 6 inches makes a lot of
sense in corn since N can be accurately placed within the 70% root mass.
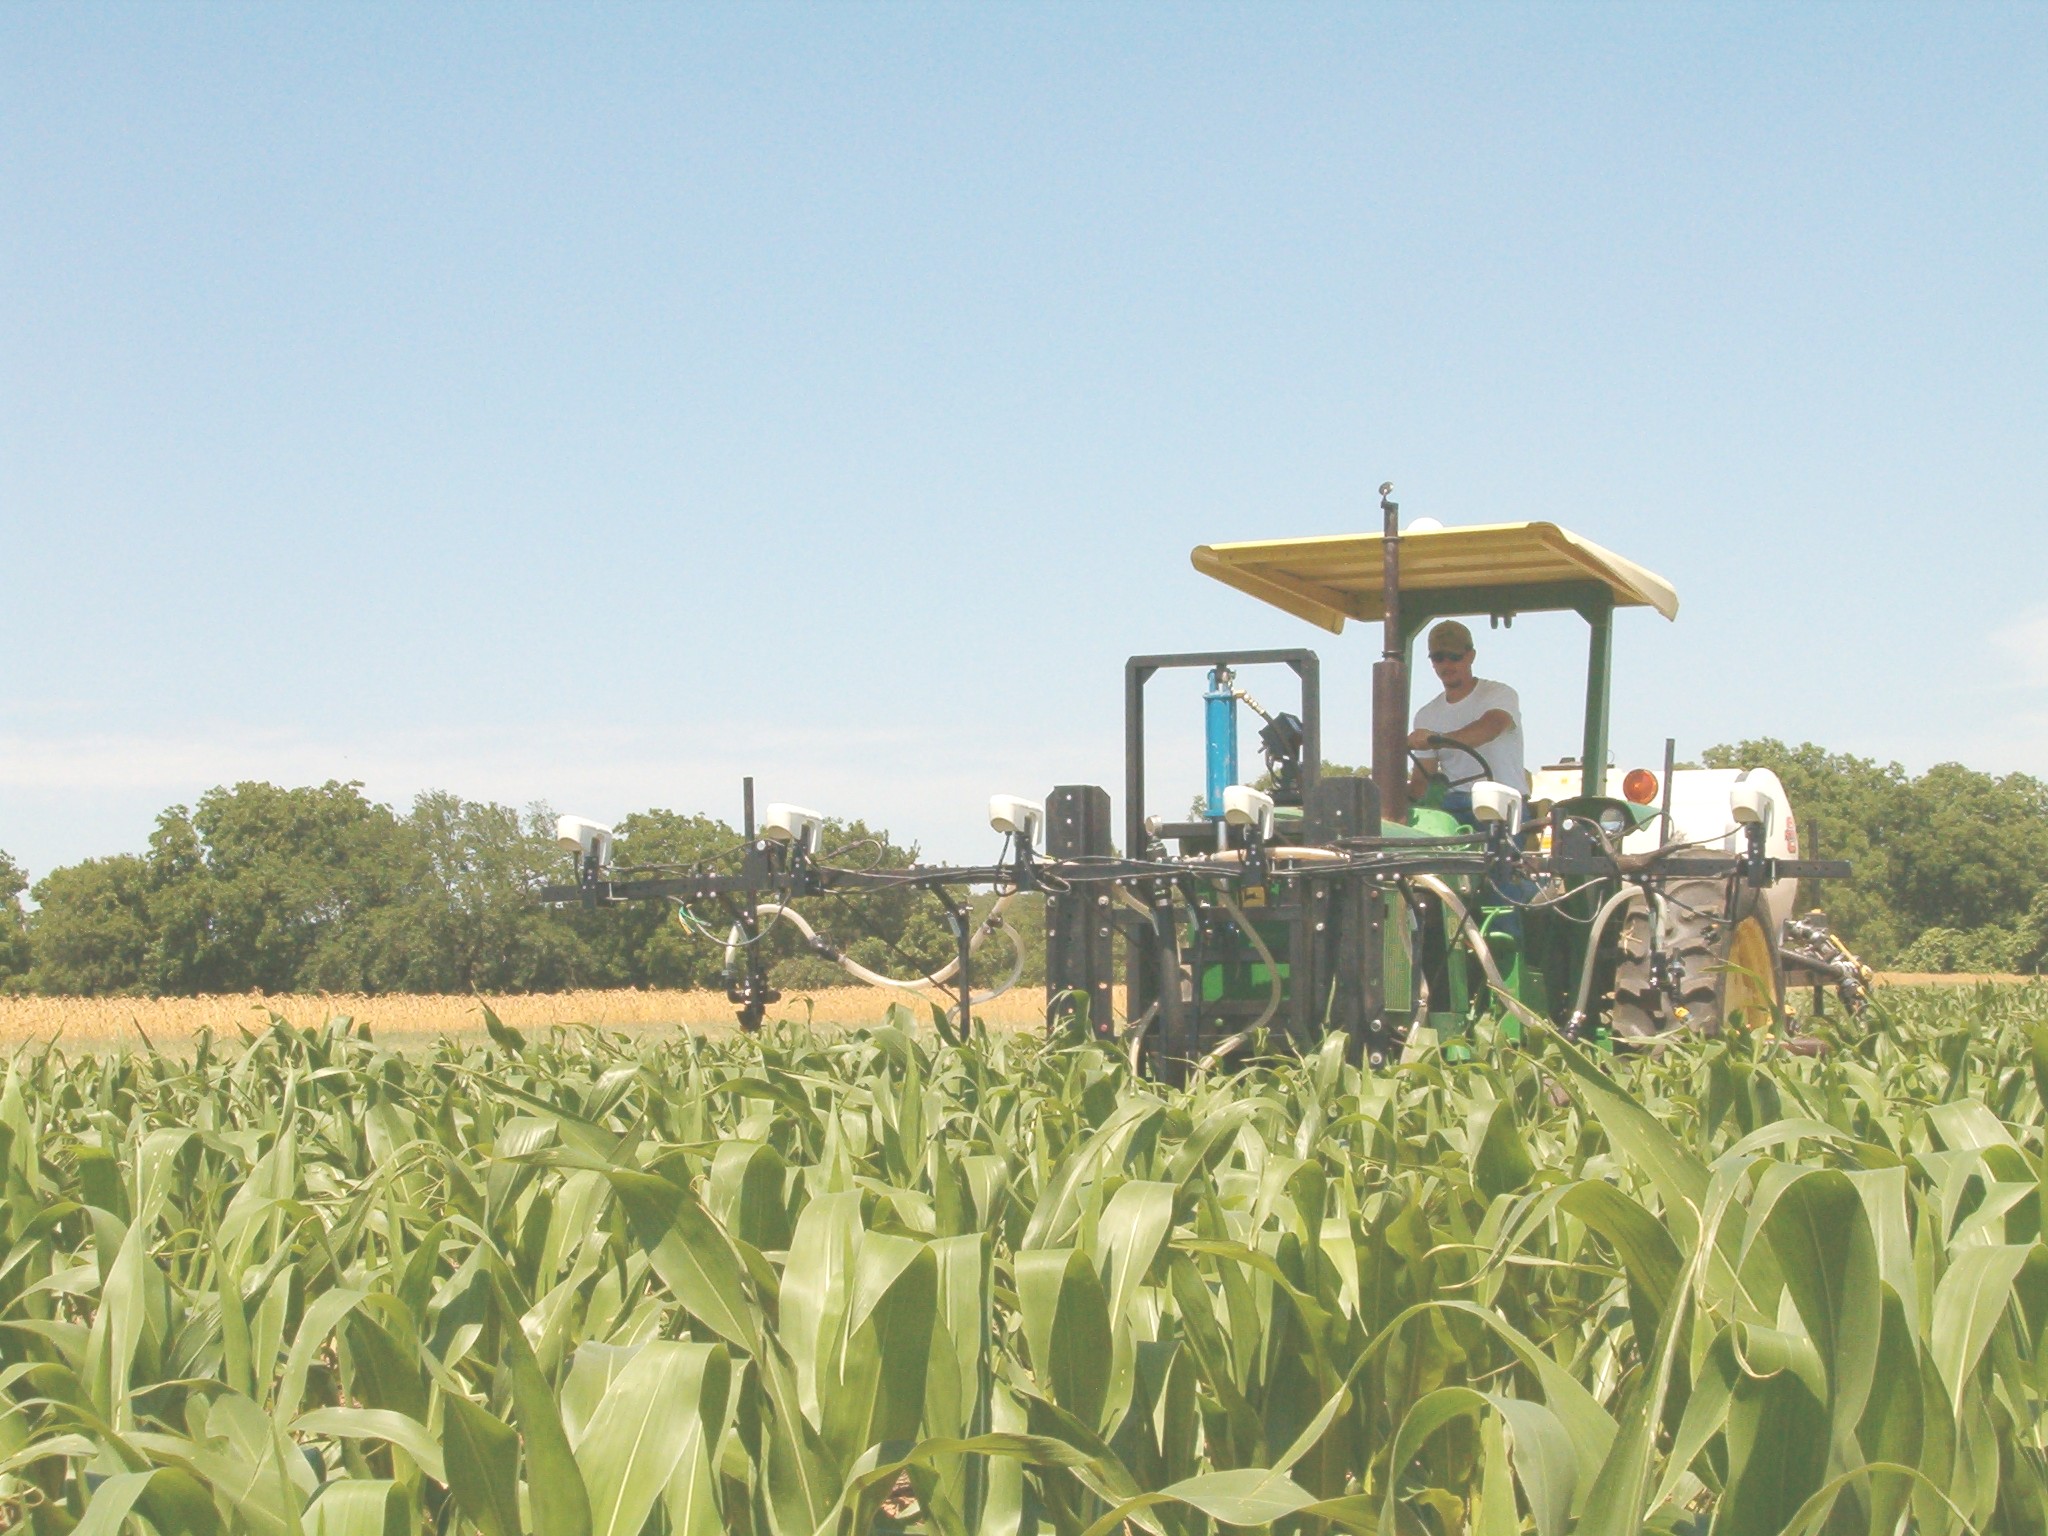
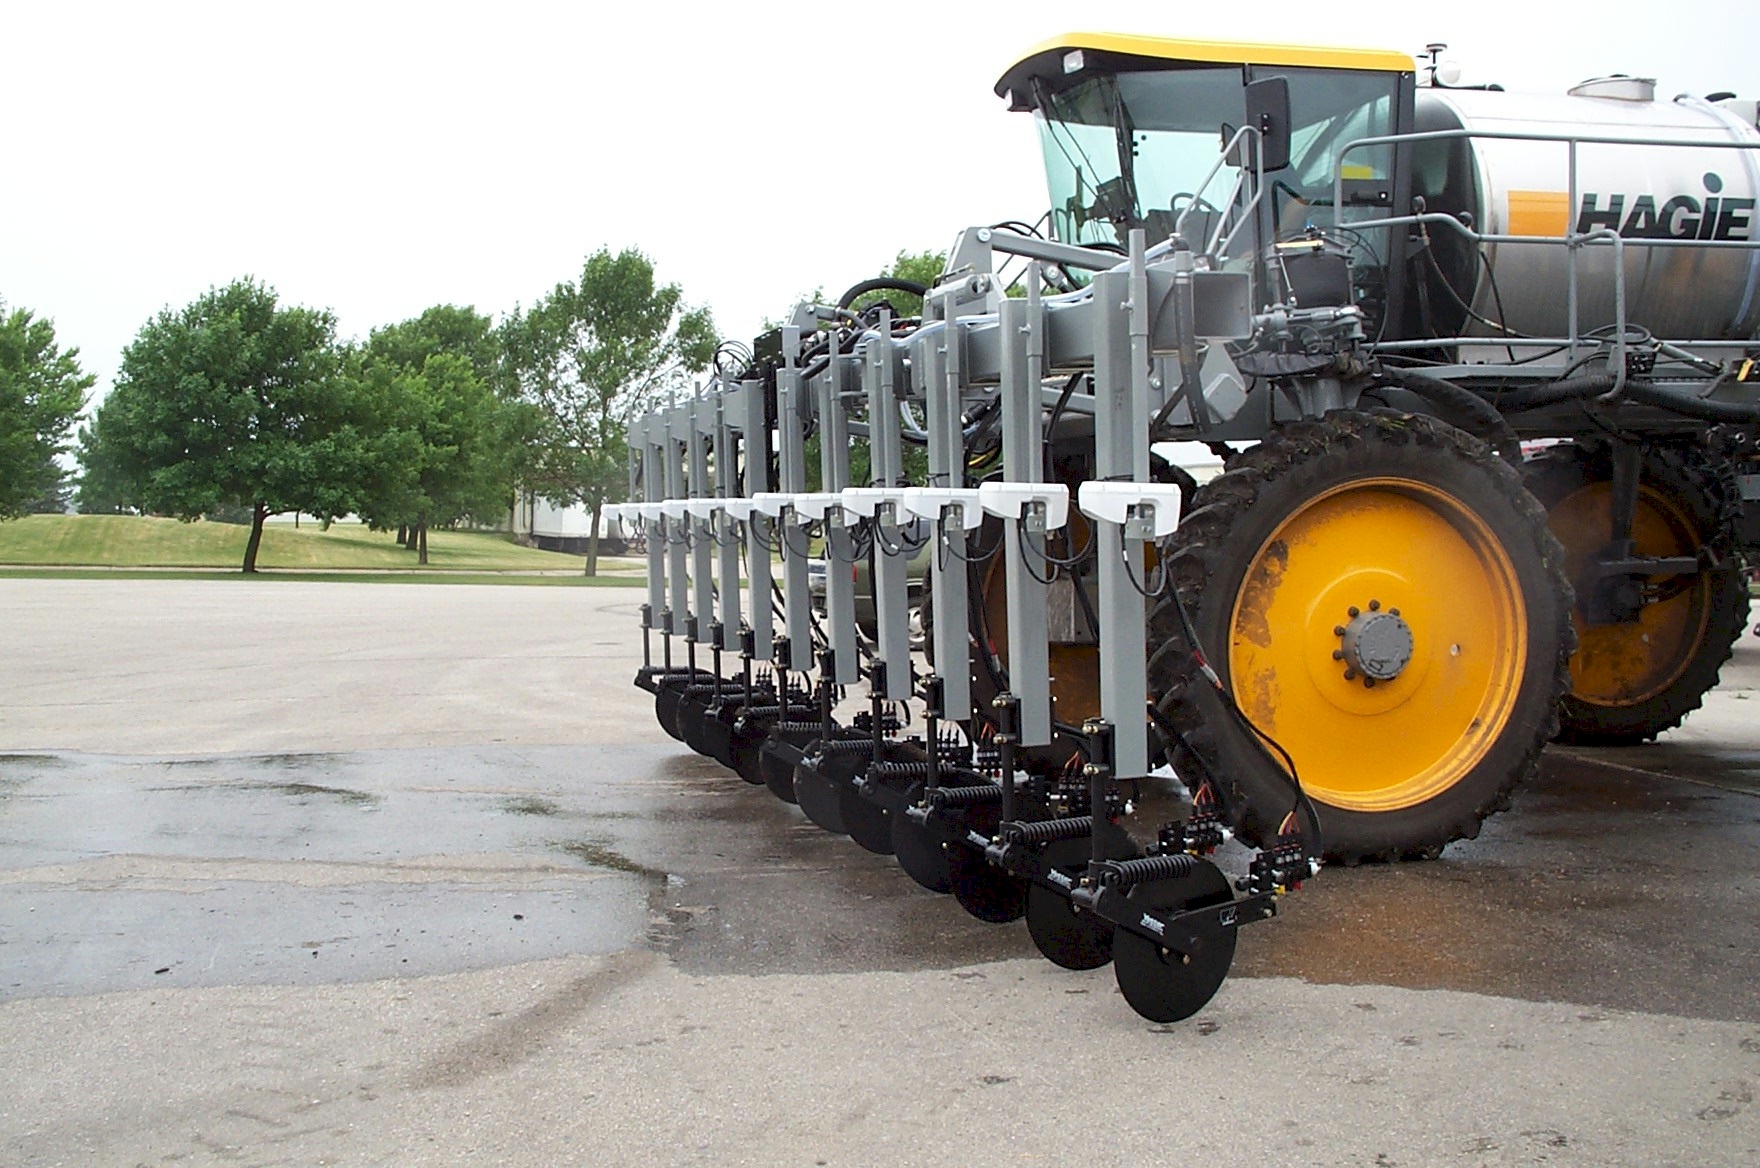
2004 Variable N Rate Applicator for Corn, June 1, 2004. Brian Arnall operates this reconfigured unit that senses and applies variable N rates, by plant. Visible in the pictures are the sensors that travel 3 feet above the row, and the drop down nozzle systems (3 per cluster).
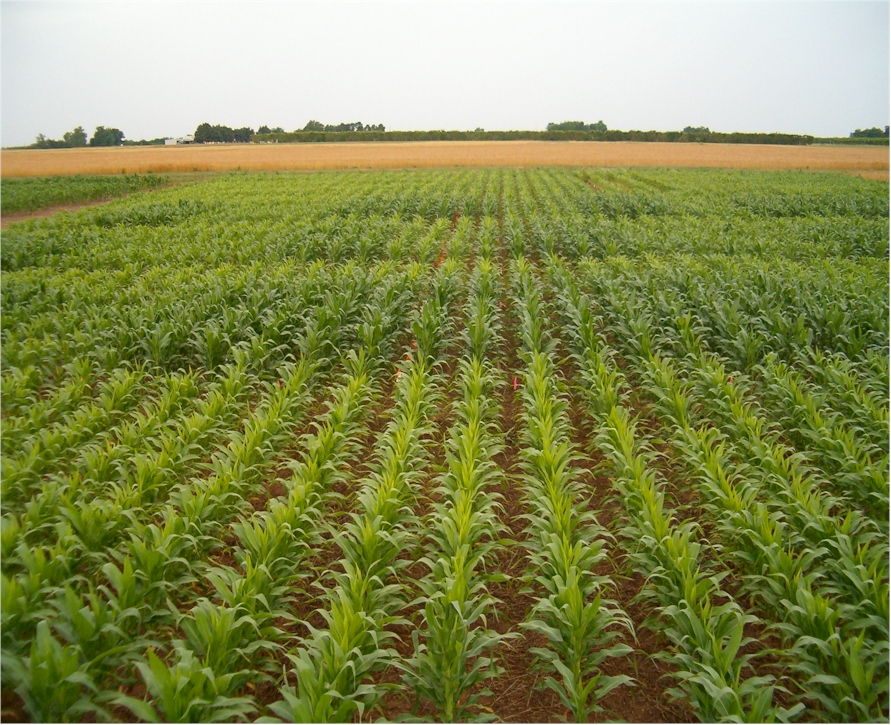
Perkins, OK Corn OFIT trials managed by Kyle Freeman & Brenda Tubana. This trial sensed on June 4, 2004, had a response index of 1.34.
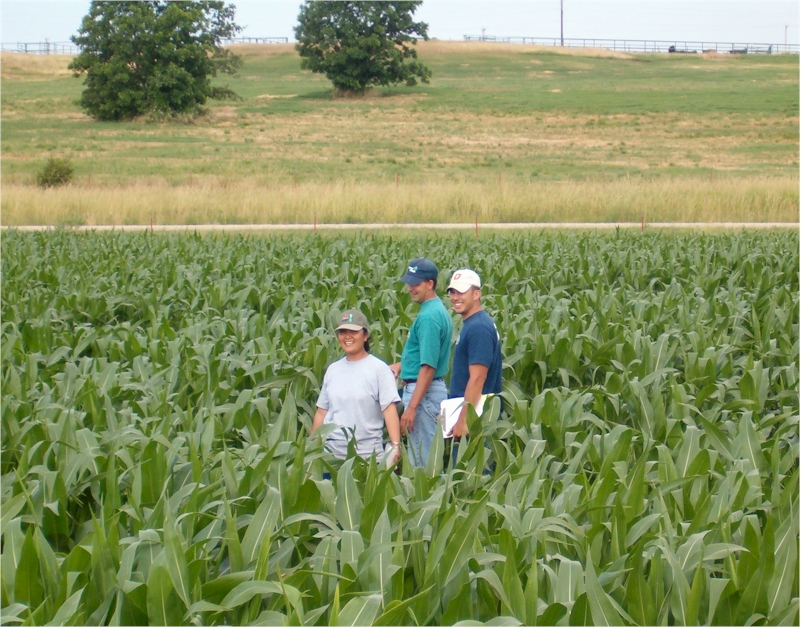
Brenda Tubana, Roger Teal, and Jason Taylor inspect the CORN OFIT trial at the Efaw Experiment Station.
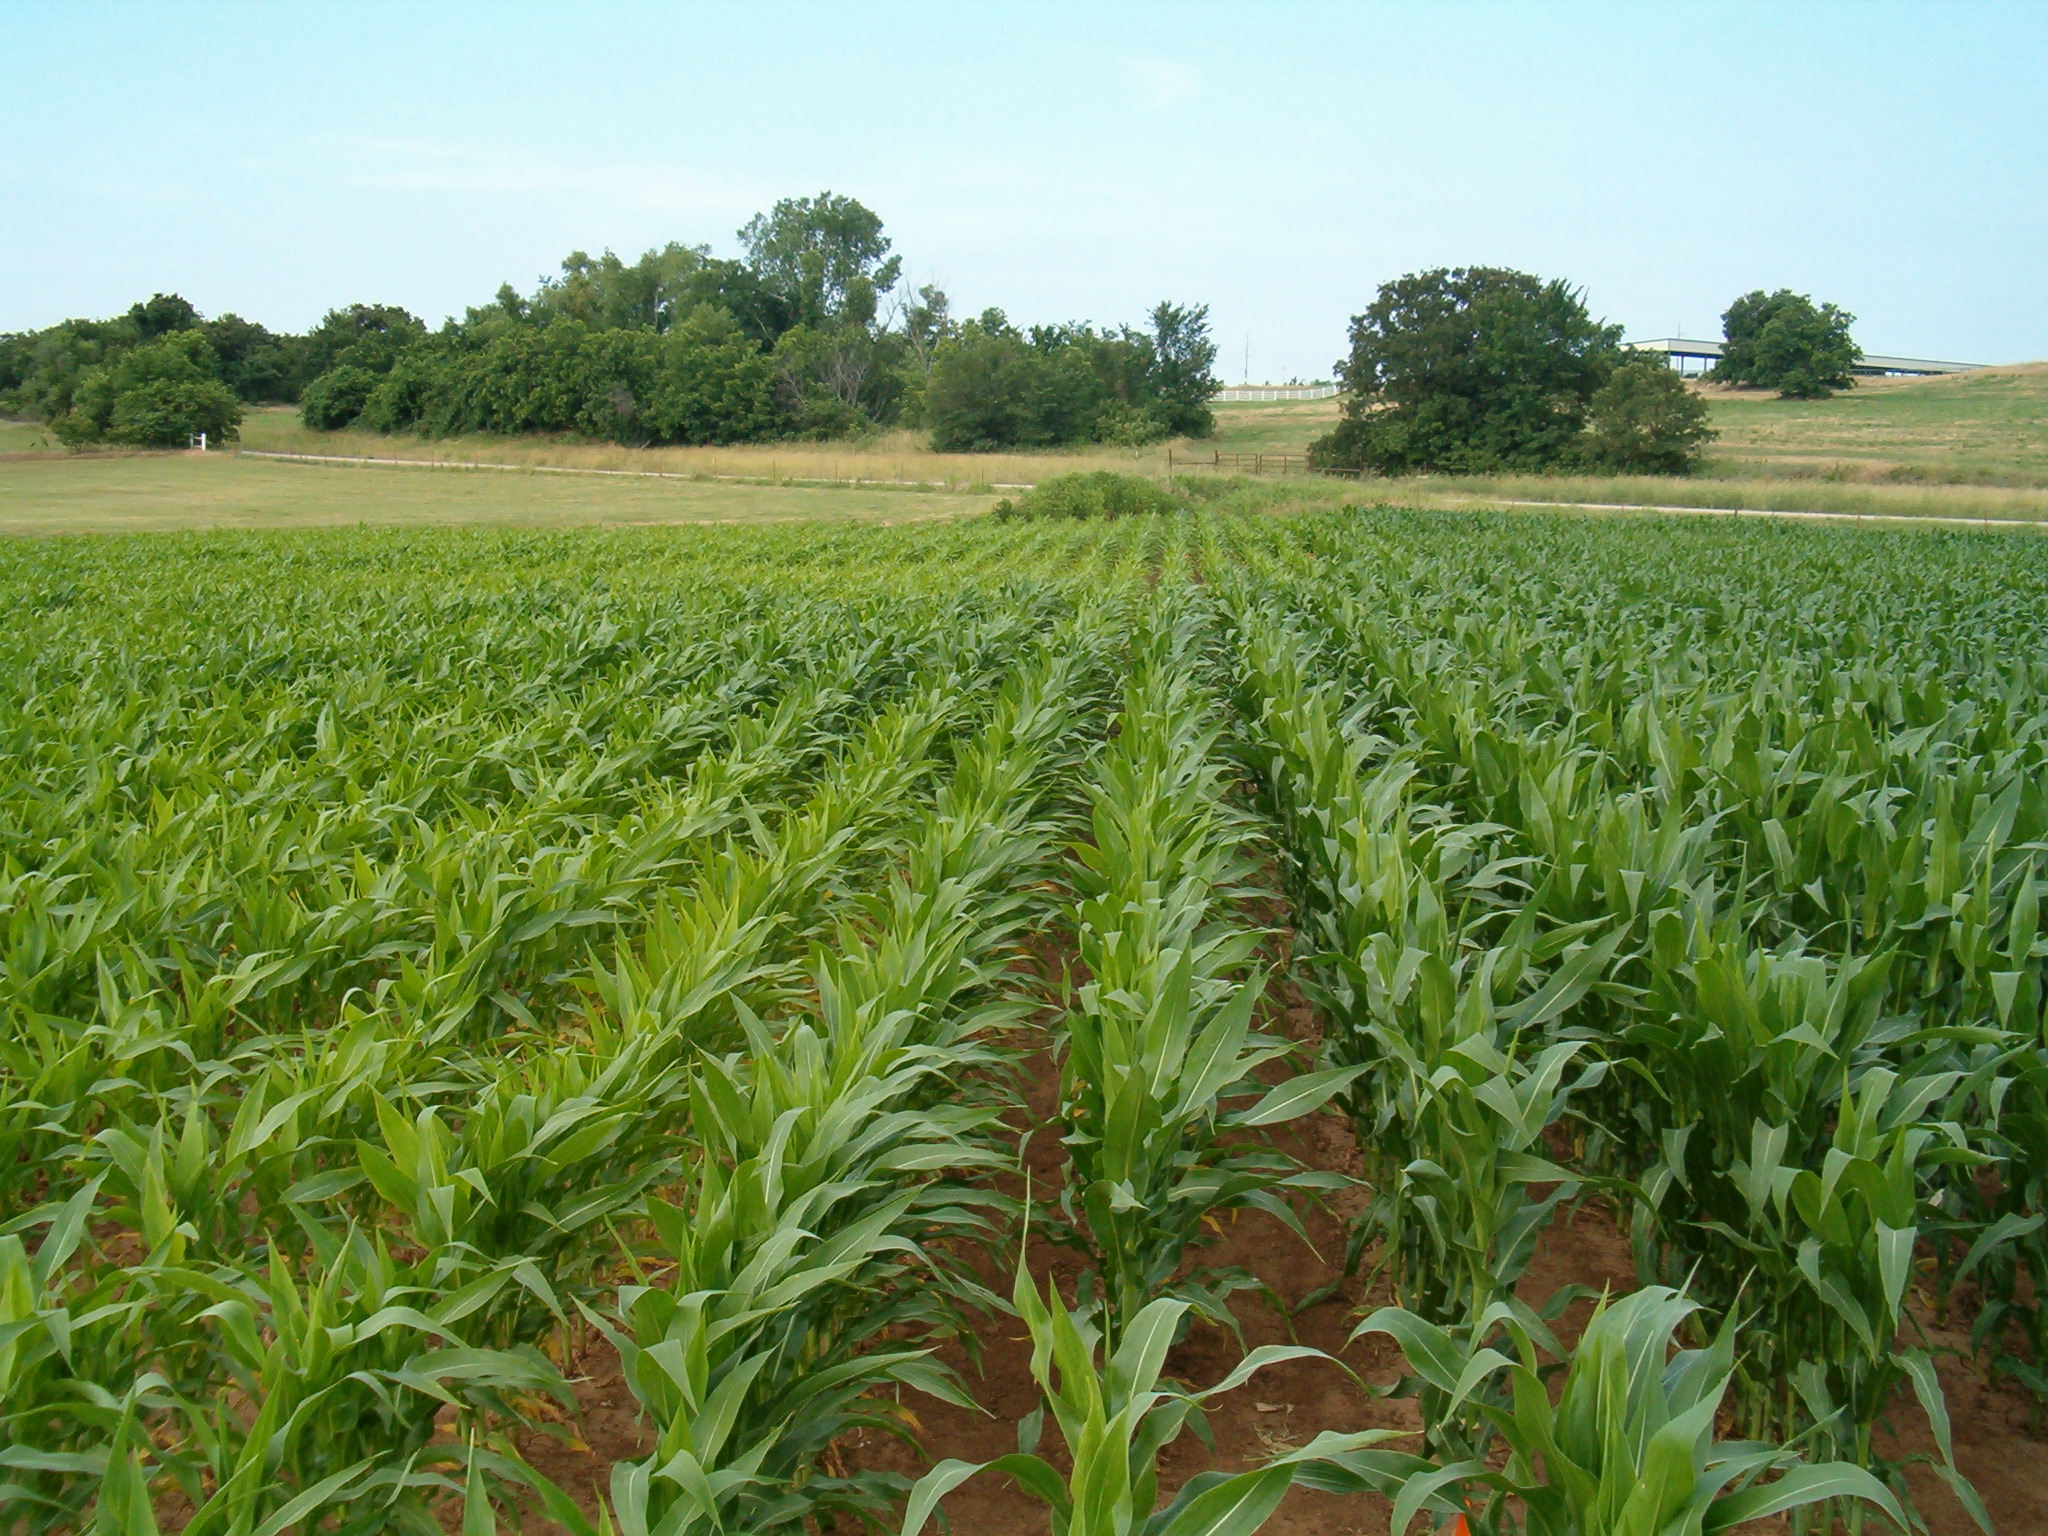
Corn trials at the EFAW experiment station, June 2004.
