Nitrogen
Deficiencies, and the Spatial
Variability of N: What is the Scale?
Nitrogen
Deficiencies, and the Spatial
Variability of N: What is the Scale?

Plant to Plant Variability in Corn Production (Agron. J. 97:1603-1611) (pdf)

World Nitrogen Use Efficiency for Cereal Production is 33%,
Agronomy Journal 91:357
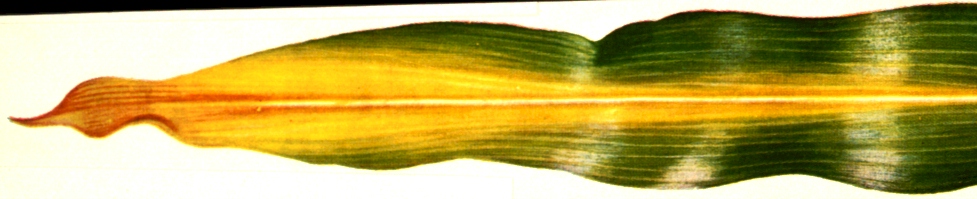
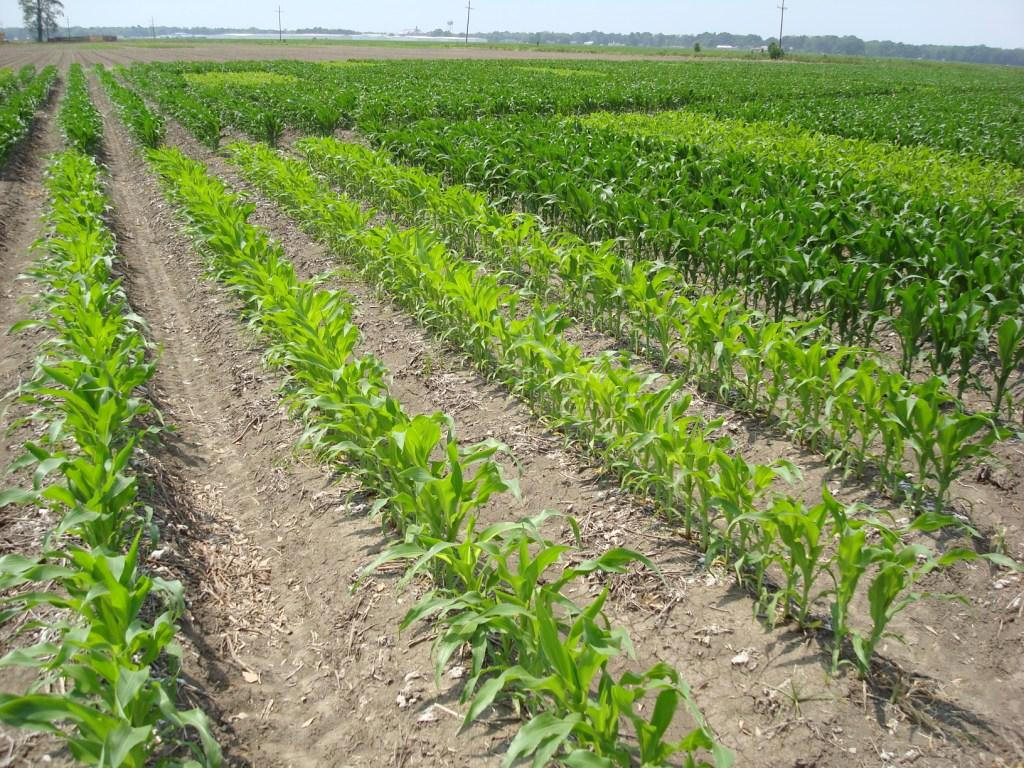
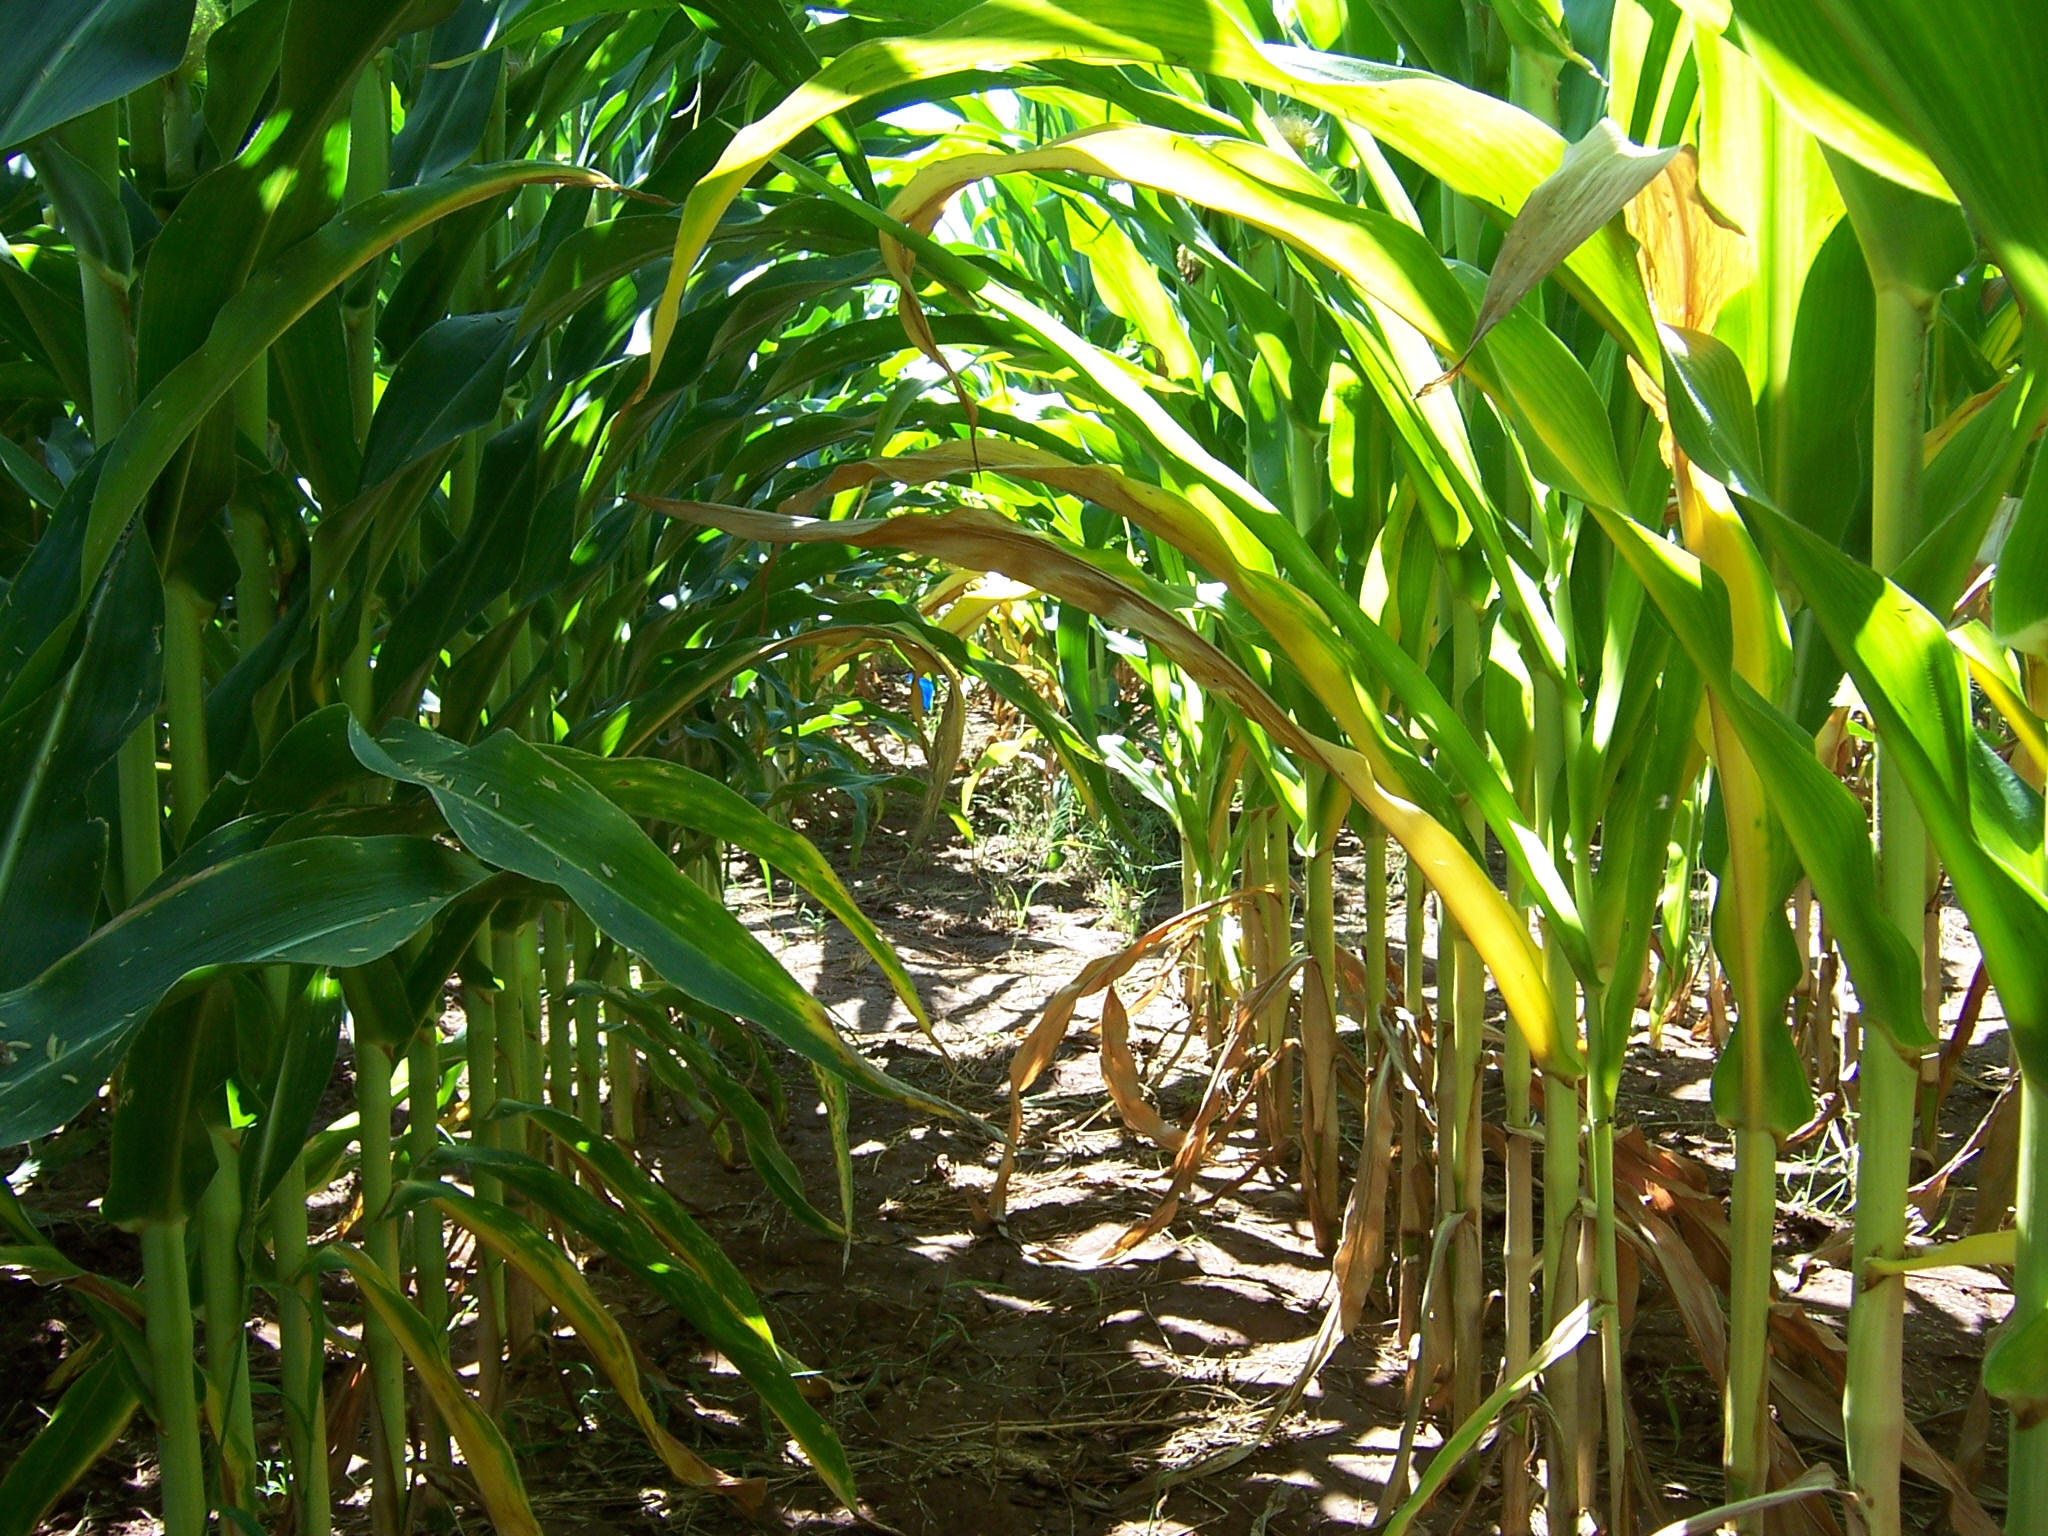
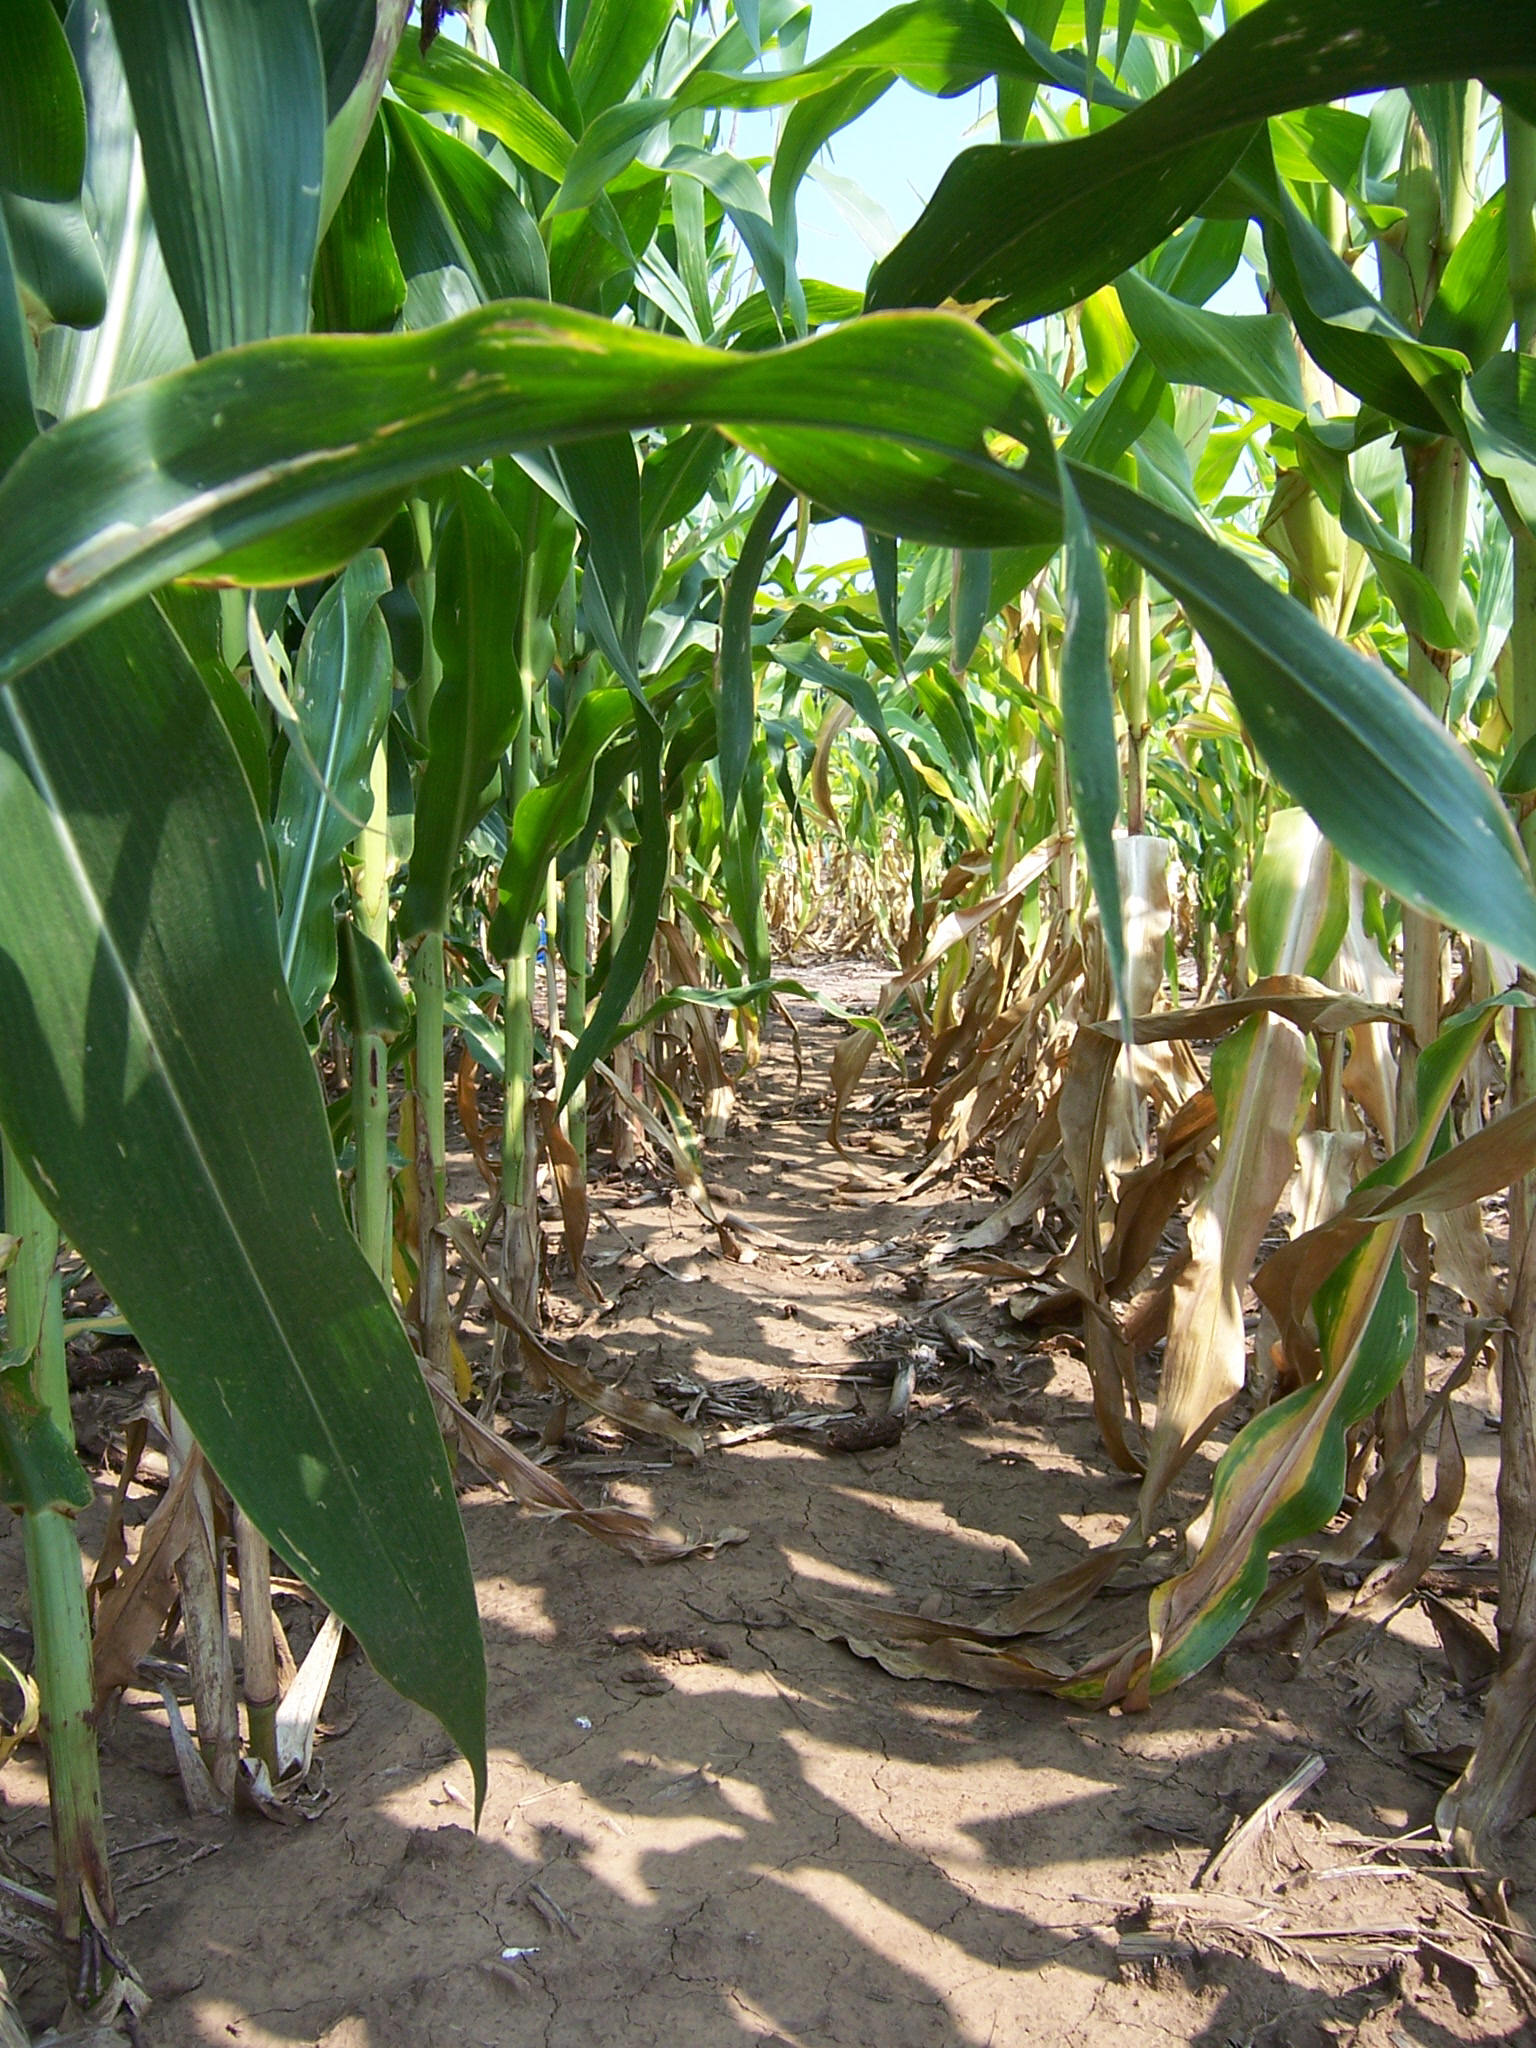
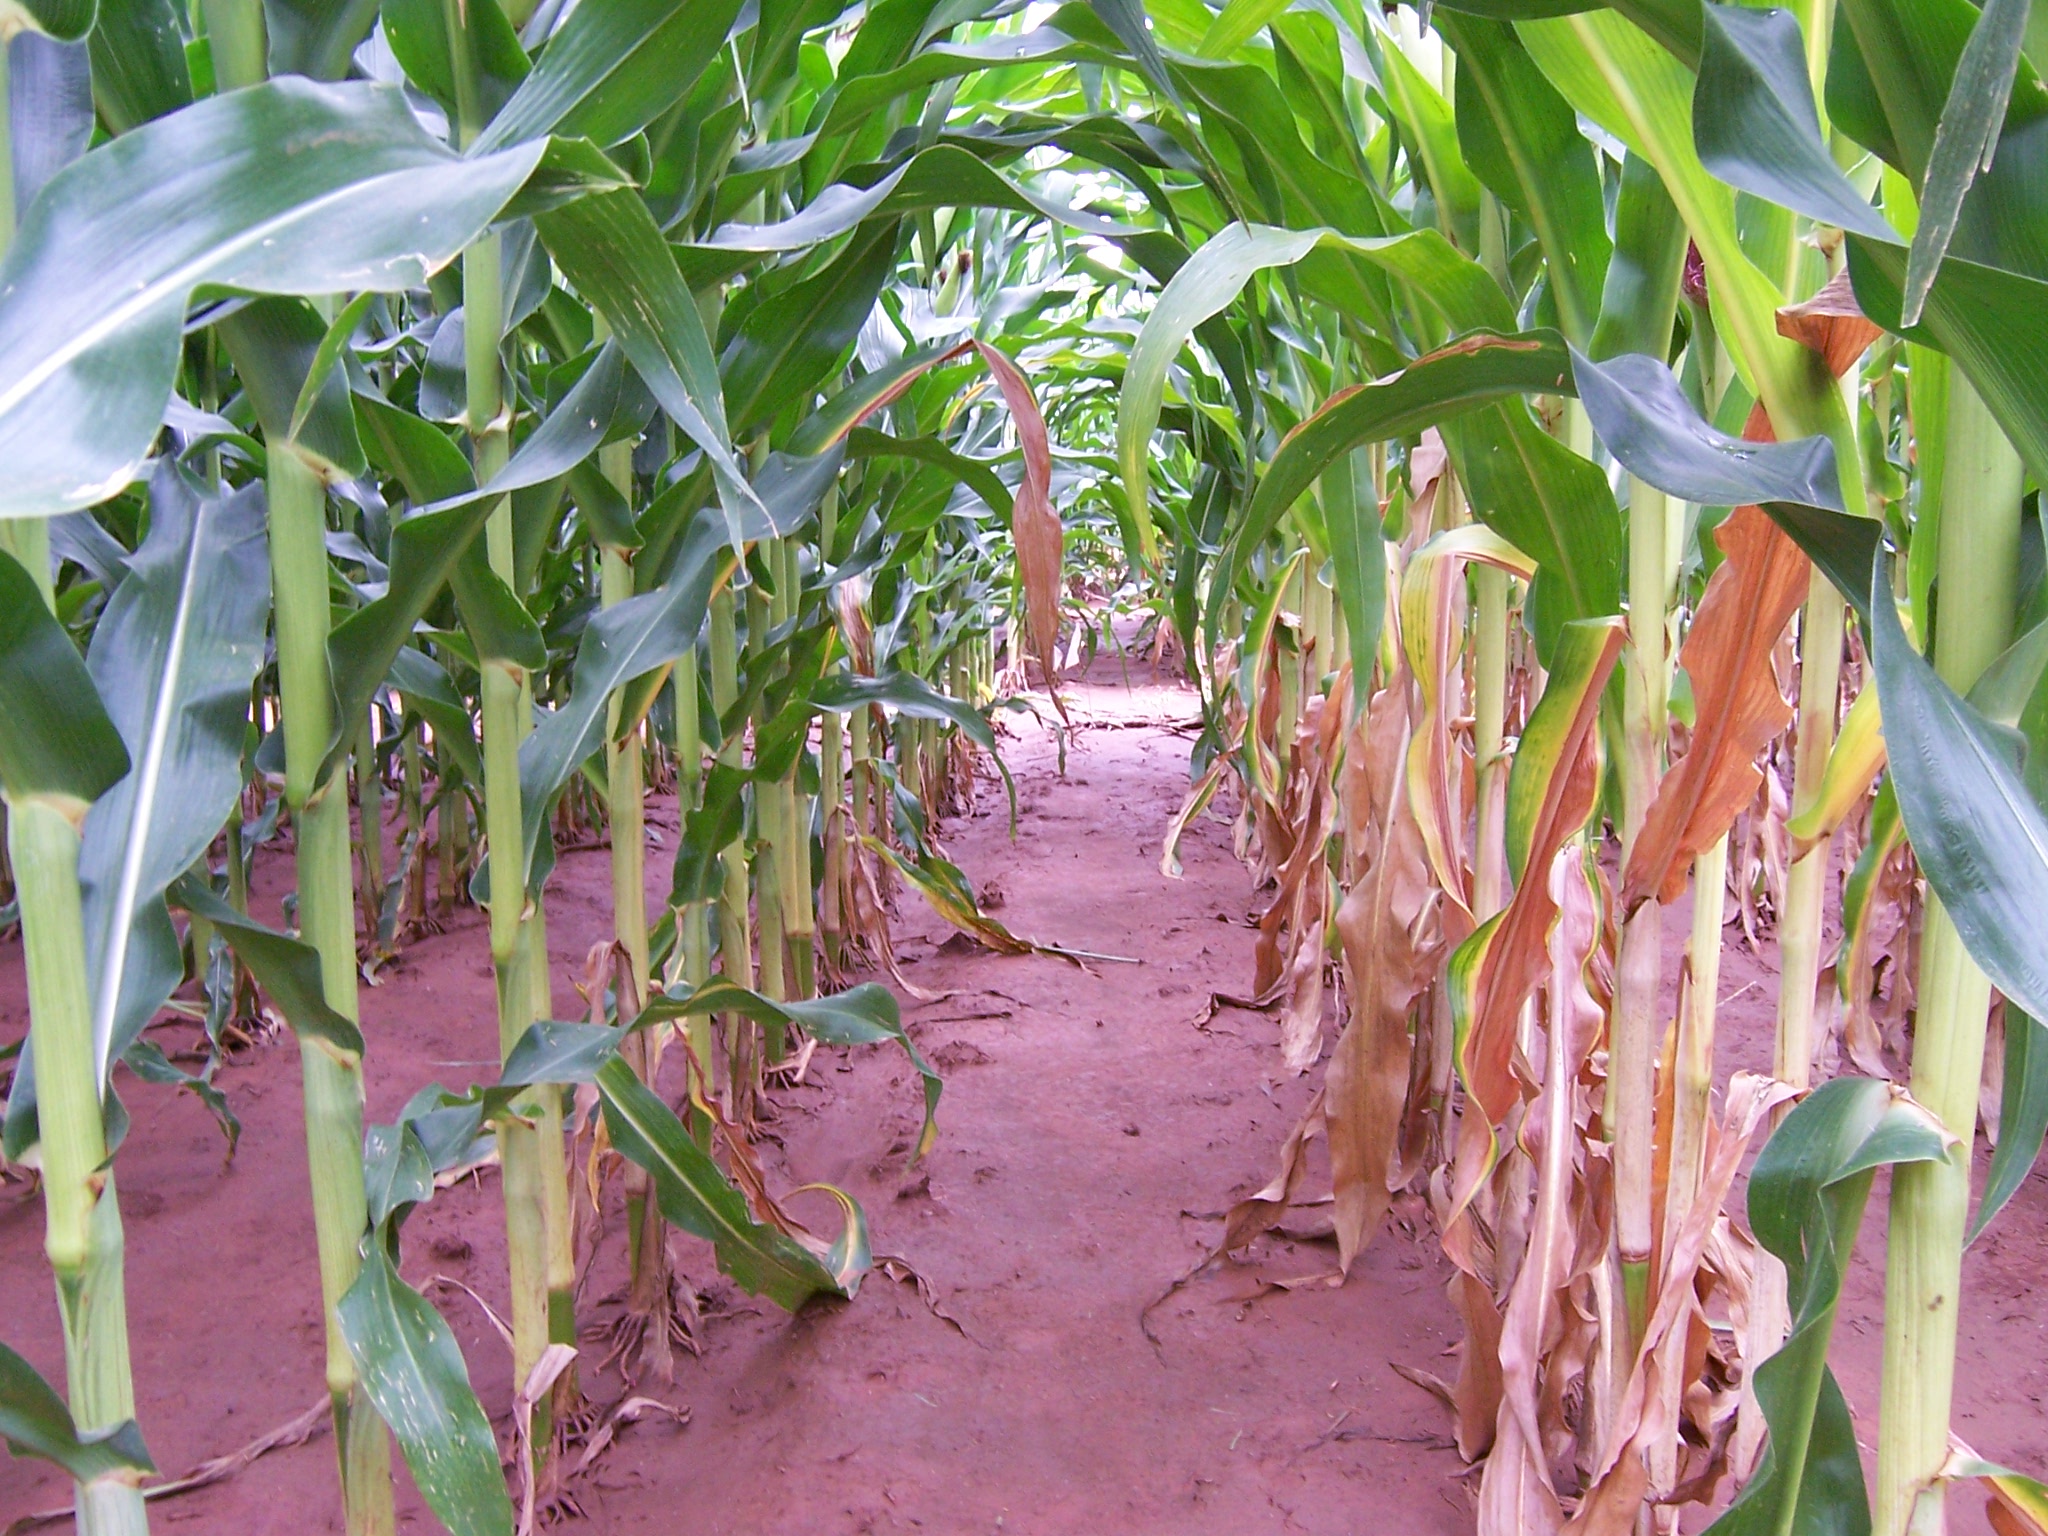
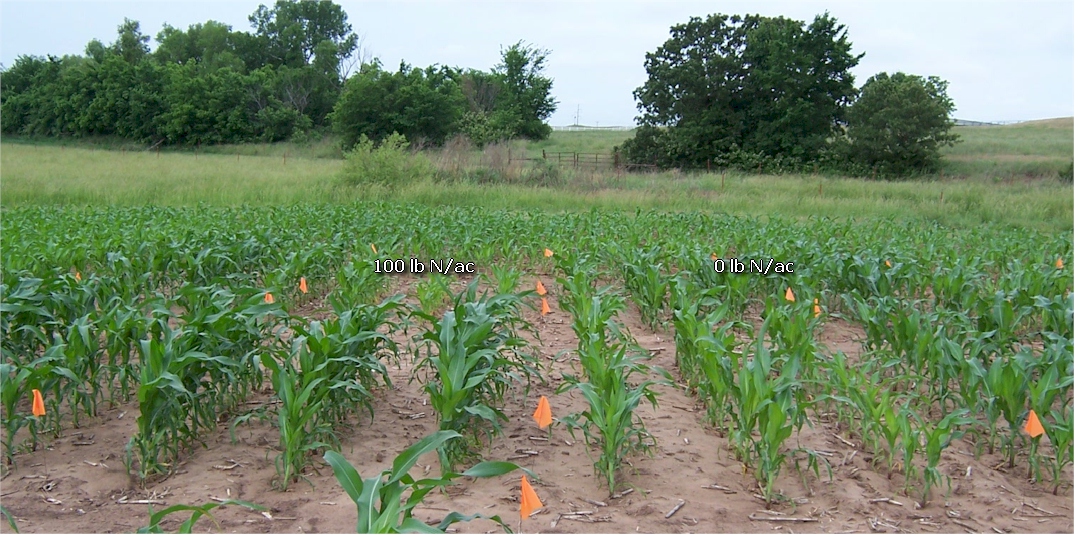
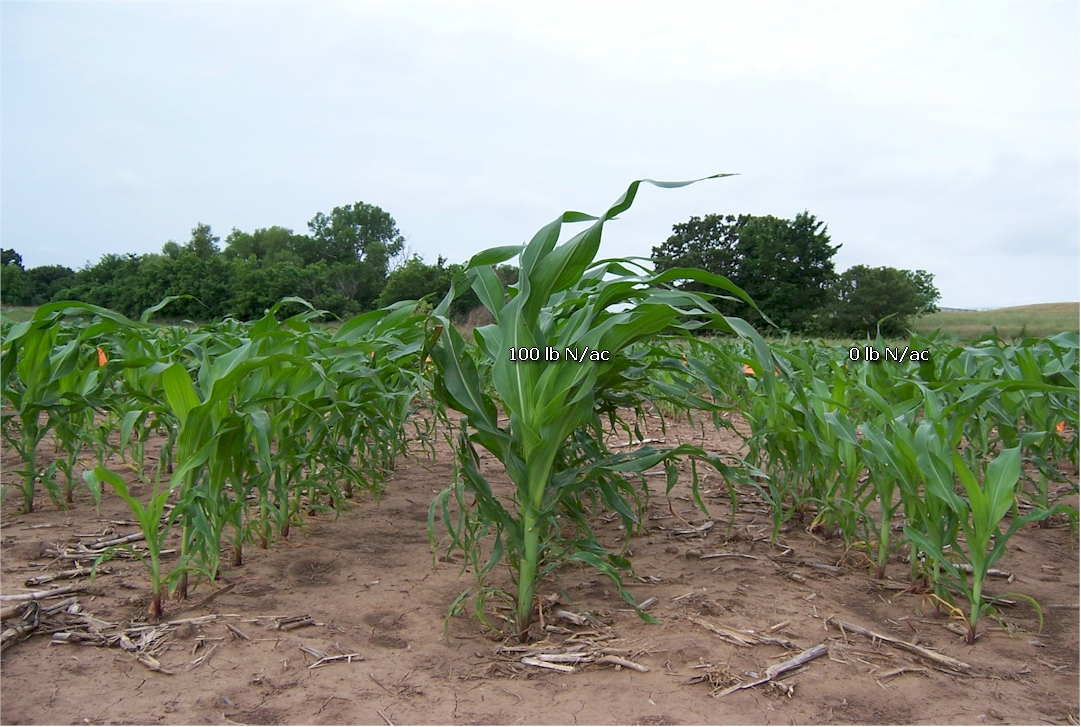
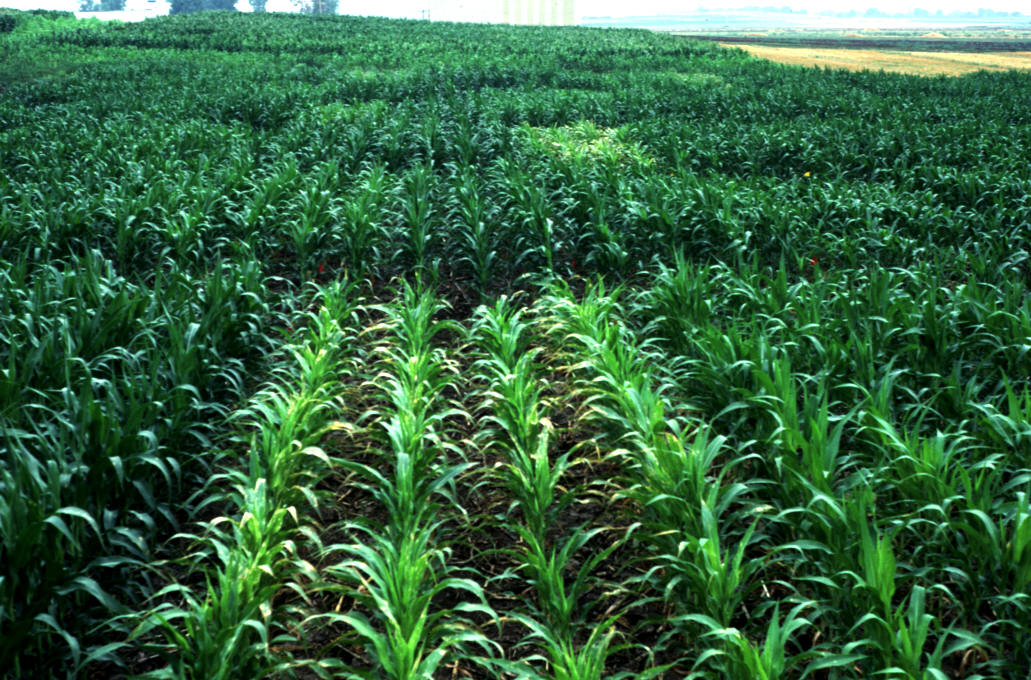
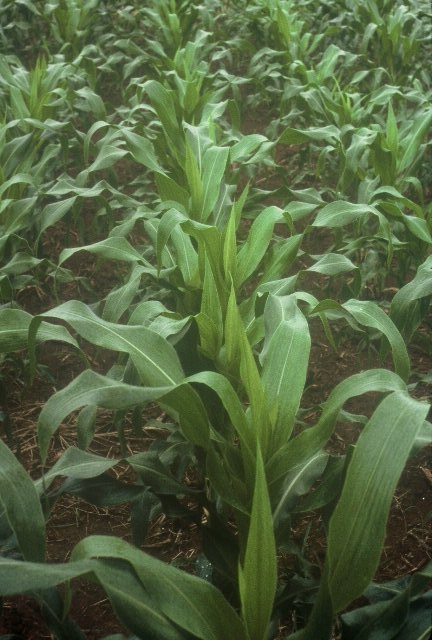
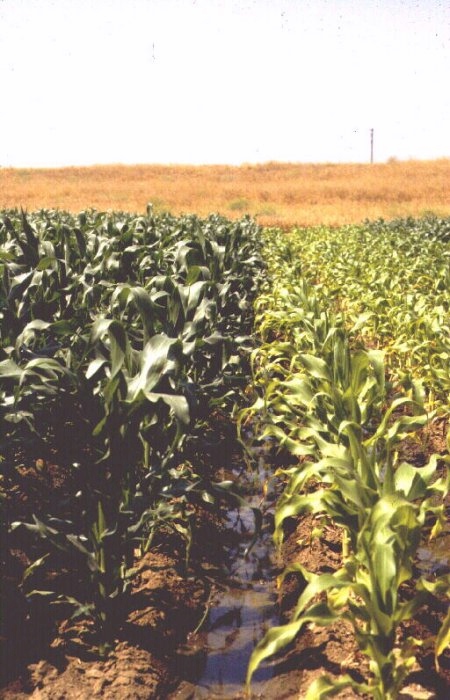
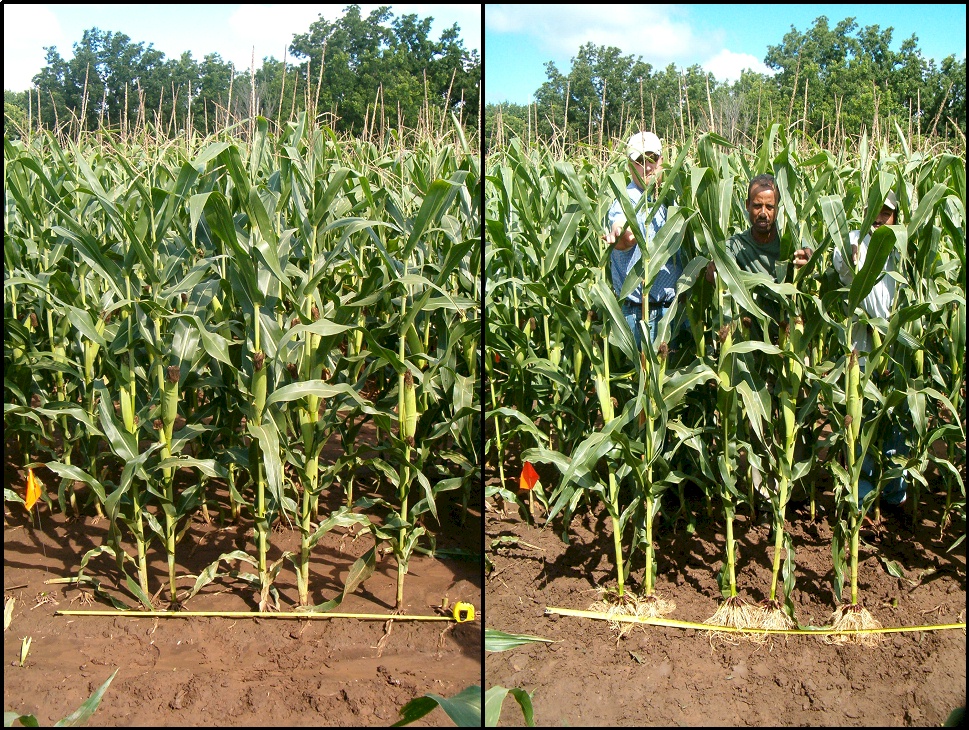
Nitrogen deficiencies first appear on the lower leaves because it is a mobile element within the plant. The deficiency generally appears first at the tip of the leaf, and moves along the middle toward the base of the plant (see above). Firing, or yellowing of the lower leaves is common in N deficient plants (see right row below). The corn row on the right received no fertilizer N, while the row on the left received 120 lb N/ac preplant. Because these differences are discernable at 30" distances (left and right), the optimum scale for treating spatial variability must be smaller than 30"x30" because seminal root systems clearly do not overlap at 30" distances.
Nitrogen deficiencies, LSU (courtesy, Dr. Brenda Tubana)
 99999999
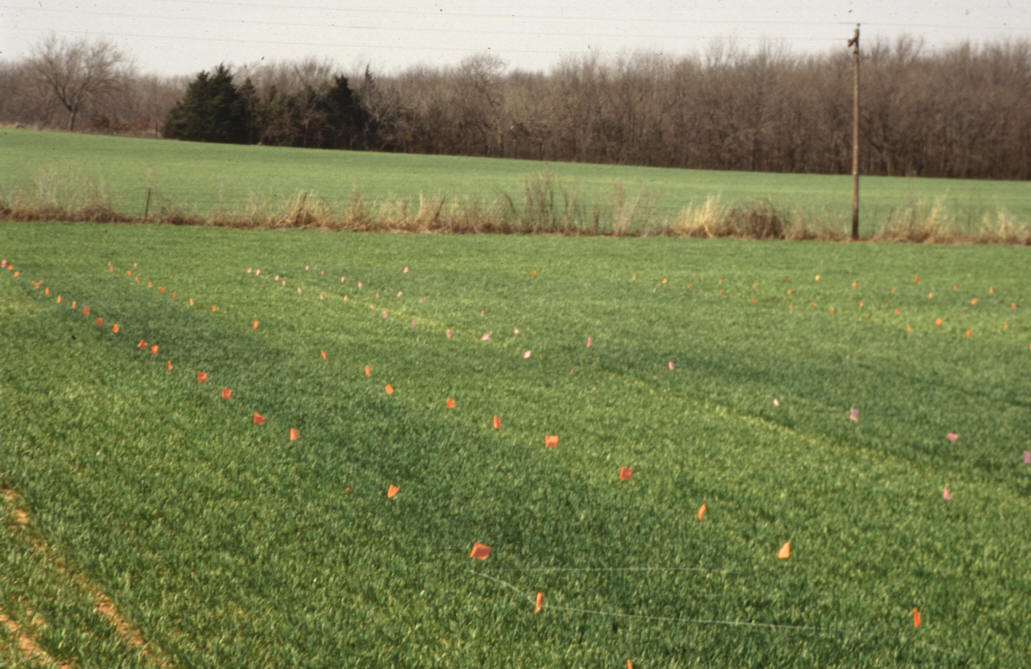
Visual N deficiencies observed by-plot, and distinguishable within 12"
plot boundaries, Perkins, OK.
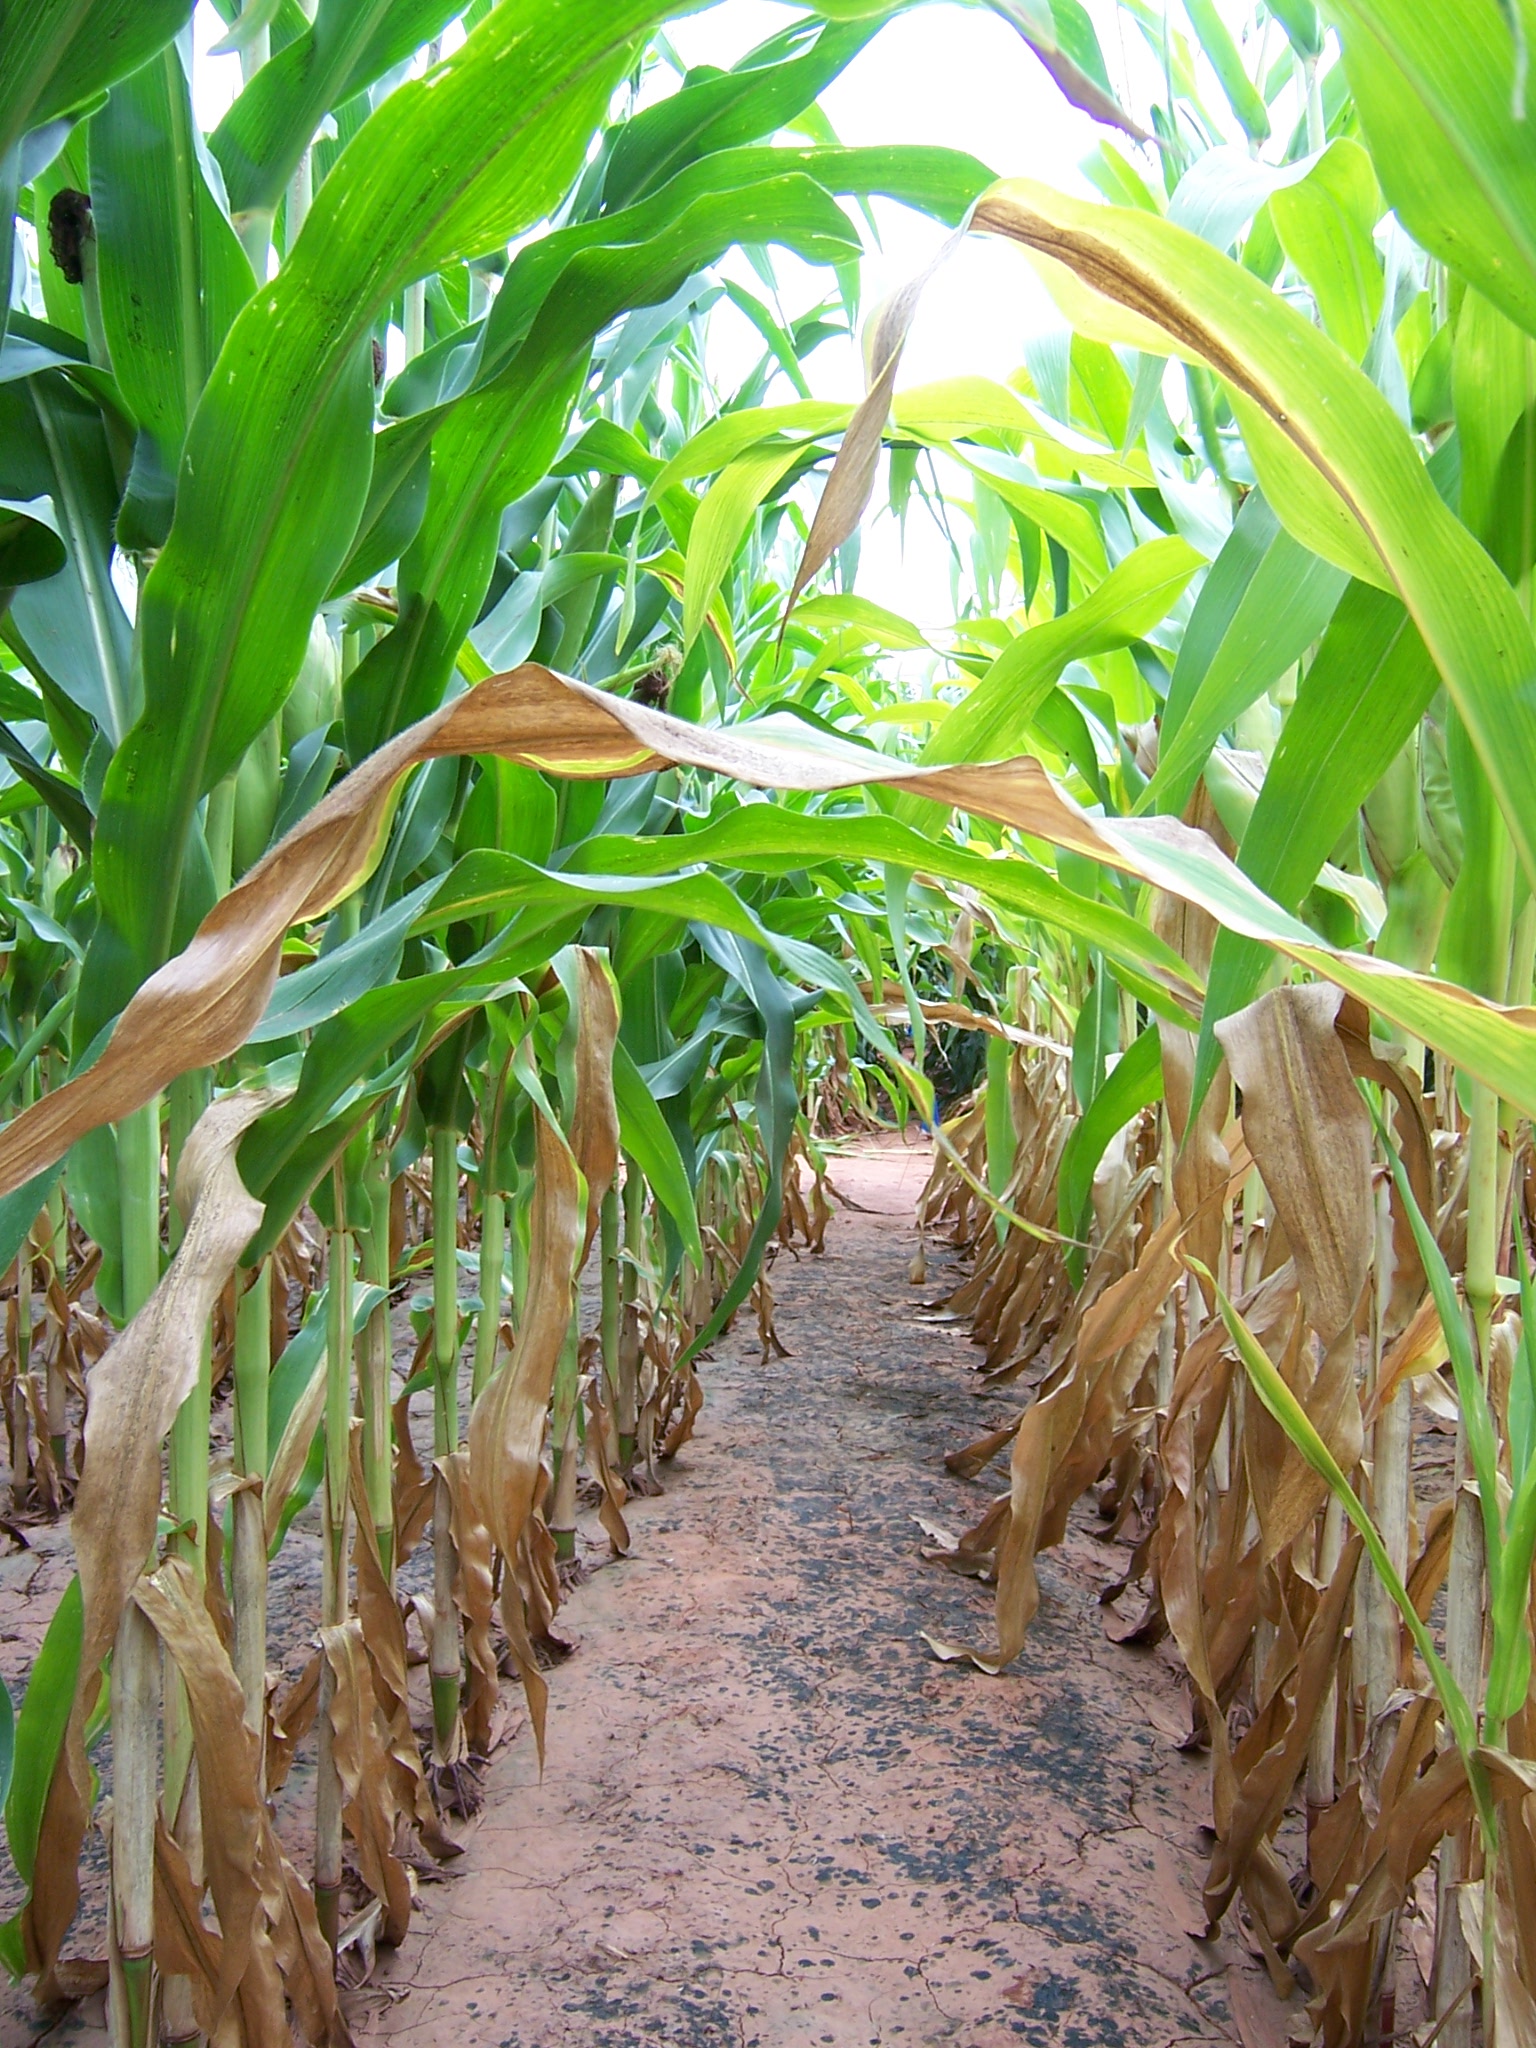
If N deficiencies can be recognized from one row to the next (example below), it is logical that the scale at which N should be applied should be no greater than this resolution (30 inches). Thus, it is not surprising to find the exact same relationship when evaluating N response in linear rows (with and without N, example above). The same minimum resolution of 30 inches (where N effects are discernable) should hold true whether it is left and right or front and back, which is in fact the case. Combined these pictures clearly show that the largest scale at which N should be applied is no greater than 30 inches. Furthermore, the corn row 30" away that received No N, was clearly N deficient suggesting that the seminal root systems did not overlap. Clearly, the seminal root system from a row of corn 30 inches away from an adjacent row receiving N could not obtain
Picture above, Courtesy of
http://www.ipe.uni-hannover.de/research.htm
Picture below taken from N fertilizer rate trials near Mead, NE, 1983.
Nitrogen deficiencies in corn production, Mead, NE, clearly observed to be different at a 1-row scale (30 inch rows employed here).

These are sulfur
deficiencies, evidenced by the chlorosis showing up in the younger leaves
unlike N that shows up in older leaves
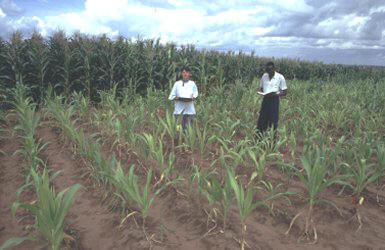
So what is the cause of the extensive variability in corn grain yield seen at all sites included in this study? Delayed and uneven emergence can be caused by variable depth of planting, compaction, seed geometry within the furrow, surface crusting, random soil clods, soil texture differences, variable distance between seeds, insect damage, and/or many other factors that influence non-uniformity of plants.
Picture Courtesy of PPI
It remains important from an N management perspective to recognize that this kind of within row variability in grain yield exists. Because N deficiencies can be seen from one row to the next (generally 76cm), fertilizing at this same scale based on yield potential, should deliver N where it is needed and at the scale where incredibly large differences in yield potential exist within rows. Because large differences in yield potential exist at resolutions of <4 plants (Figure 4) that occupied a linear distance of 70 cm, and it is known the visual differences are easily recognizable by-row (normally 76 cm wide), applications at this same scale can deliver N fertilizer based on need.
Maddonni and Otegui (2004) noted that increased interplant competition in corn hybrids enhanced the appearance of plants with different competitive abilities. Thus at higher populations, plant-to-plant variation can also be expected. They noted that the onset of interplant competition started very early during the growing cycle, and that estimated plant biomass between stand densities were detected as early as V6. Furthermore, they reported that plant population and row spacing treatments did not modify the onset of the hierarchical growth among plants.
Because yield potential can be predicted early in the season, nutrient management decisions can be made based on predicted yield potential and nutrient removal (at a specific yield potential), especially when considering that the average differences were 11.1X in 8-30 m of row (Table 3). Even though there are clearly errors associated with predicting yield at early growth stages (V8, Figure 5), these errors in yield prediction are dwarfed in comparison to the 11.8X average differences in by-plant yield within row. Thus, as was noted earlier, even if yield prediction were off by 100%, it is an incredibly small error next to the 1110% differences in actual yield. Recognizing and treating the differences in yield potential based on predicted amounts of nutrient removal will lead to a vastly improved mid-season N management, provided that by-plant yield prediction is possible.
Other Deficiencies (courtesy of PPI) are listed below.
Do corn roots overlap when plants are more than 7 inches apart? When corn plants were excavated from a corn field to a depth of 2 feet, few rooting cylinders overlapped, unless plants were less than 7 inches apart. Over 70% of the root mass was found to exist within a 6 inch diameter of the stalk, further supporting by-plant variable N application in corn.
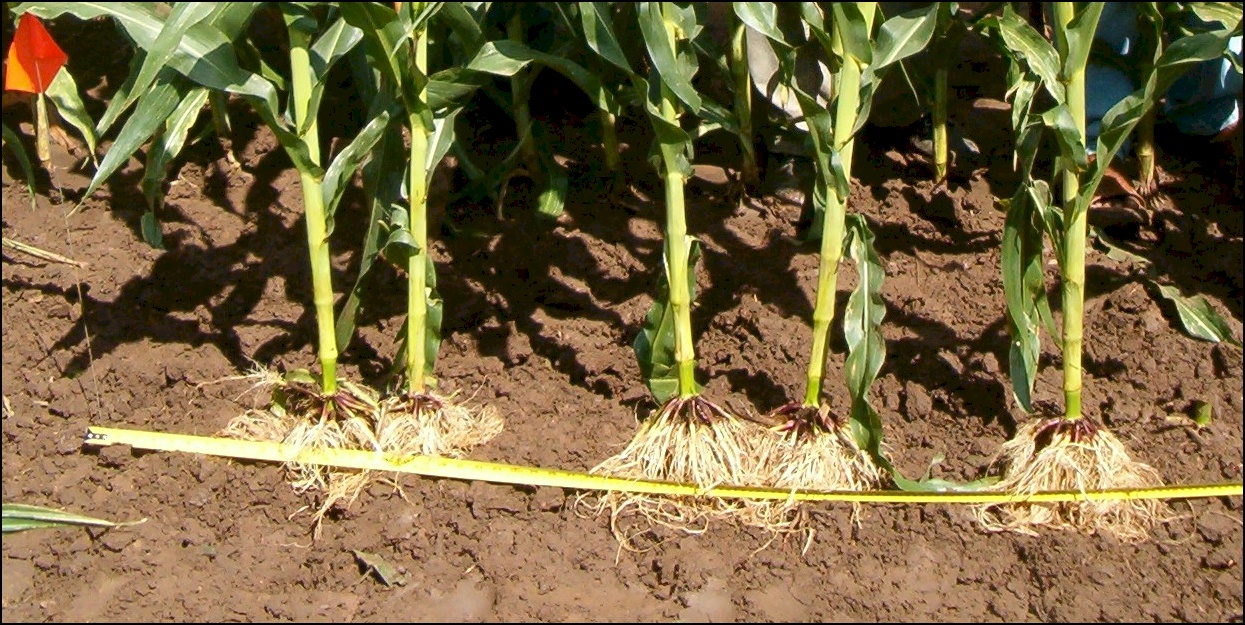
After excavation and complete root washing, corn plants were placed in the
exact same location as from the slide above. Root systems from these
plants were then thoroughly evaluated. Unless the plants were within
6 inches of each other, the 70% by-plant root mass (exists within a 6 inch
radius of the stalk) did not overlap with bordering plants. Thus
treatment of each plant or every 2 plants within 6 inches makes a lot of
sense in corn since N can be accurately placed within the 70% root mass.

Grain yield determined using a fixed distance between plants (average of every two plants) (ABOVE)
Grain yield determined using the actual distances between plants (average of every two plants) (BELOW)
Note that the variability (standard deviation) was basically the same, with the range actually being wider using fixed distances. The variability present is clearly not "area" dependent.


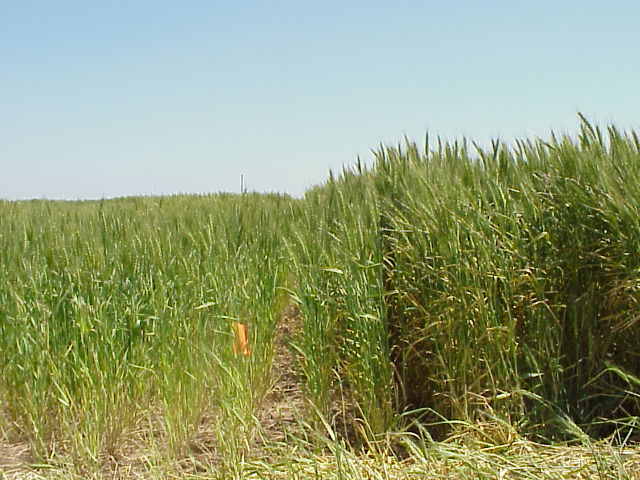
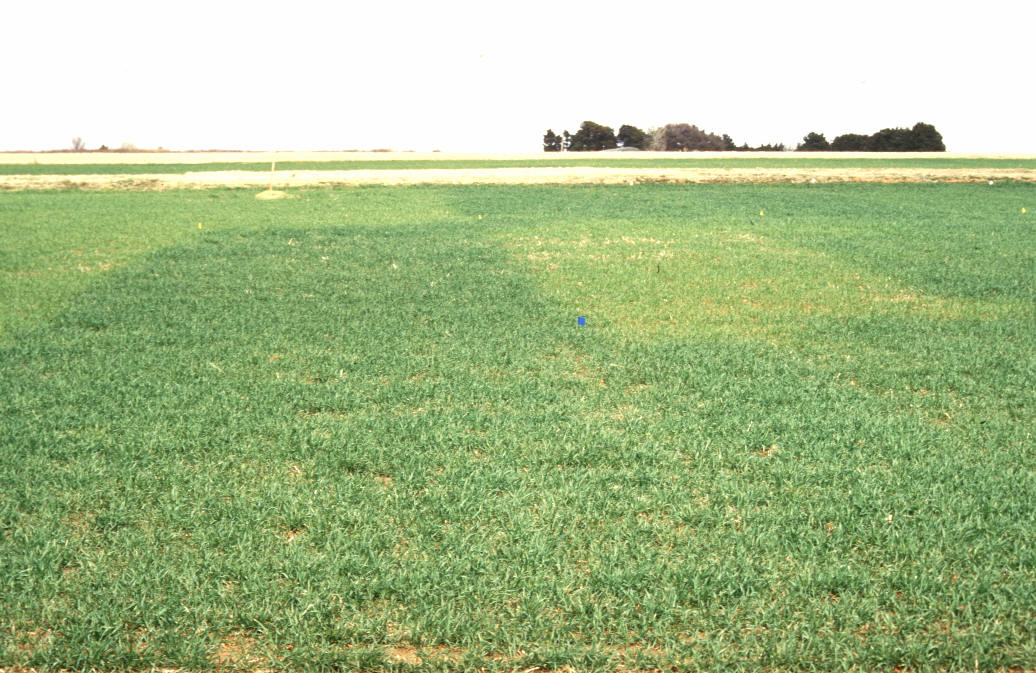
Response to applied N in wheat,
Tipton, OK, 1999. What is the scale at which differences can be
recognized? The distance between rows in this study was 7 inches.