 NEW N Management Strategy for Corn and Wheat
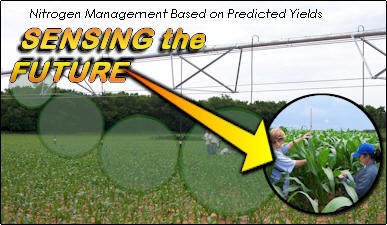
Nitrogen Management Based on Predicted Yields and N Responsiveness
 Sensor Based
Nitrogen Rate Calculator, on-line since 2002
Sensor Based
Nitrogen Rate Calculator, on-line since 2002 Includes 14 algorithms for Corn, Wheat, Sorghum, Canola, and Bermudagrass
EXTENSION of the Concept, Dr. Brian Arnall
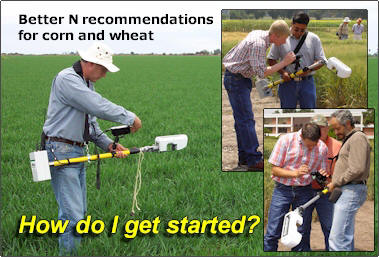
How do I get Started? START READING HERE
Improved N recommendation strategies are more important today than ever. Nitrogen fertilizer has now exceeded $0.50 per pound of actual N in many parts of the USA, largely due to rising oil and natural gas prices. In this light, methods that increase nitrogen use efficiencies, and farmer profitability are no longer simply commendable, but required. Applying all N preplant for cereals, well known to be the most inefficient method of applying fertilizer N is no longer acceptable, since field tested alternatives are available.
The N Rich Strip program discussed in the next few pages along with the Sensor Based Nitrogen Rate Calculator can provide farmers with immediate improvement in NUE, and profit. Questions, regarding this program can be directed to Bill Raun, John Solie, or Hailin Zhang (bill.raun@okstate.edu) VOICE 405 744-6418 and FAX 405 744-9575).
 The
Future: N RICH STRIPS or Ramped
Calibration
Strips
The
Future: N RICH STRIPS or Ramped
Calibration
Strips
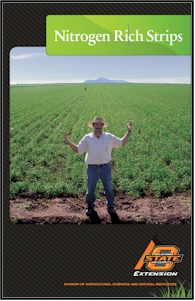
Nitrogen-Rich Strips replace the use of yield goals for making
mid-season fertilizer-N recommendations.
Maximum wheat yields vary greatly from year-to-year, and the amount of N that the environment delivers (essentially for free) changes even more. What is this free environmental N? After crops are planted, there is a lot of N that can be used by the plant that does not come from fertilizer. In general this free N comes from two sources, N mineralized from soil organic matter and that deposited in the rainfall. If conditions from planting to mid-season are warm and wet, the N mineralization (N in organic matter that becomes available) can lead to over 40 lbs N/ac made available to the crop. Up to an additional 20 lbs of N in the rainfall can lead to a total of over 60 lbs N/ac without ever applying any fertilizer. Alternatively, if conditions from planting to mid-season fertilizer N application are cool and dry, less than 20 lbs of N/ac will be delivered to your wheat crop from the environment (organic N and rainfall).
Nitrogen Rich Strips can tell you how much N the environment delivers, and when using our web-based Sensor Based Nitrogen Rate Calculator, we can tell you exactly how much additional mid-season fertilizer N should be applied to achieve maximum yields.
http://www.soiltesting.okstate.edu/SBNRC/SBNRC.php
How is this done? Using the GreenSeeker Hand-Held Sensors, actual wheat or corn grain yield potential can be estimated using the NDVI readings (value output from the sensors) from the Nitrogen Rich Strip compared to the Farmer Practice, and knowing the date when the wheat was planted. Essentially, the NDVI value from the hand-held sensor outputs total biomass. For readings collected between January and March (regardless of when the wheat was planted), we can estimate biomass produced per day. This value is used to predict the wheat grain yield obtainable. With these numbers we can accurately predict both the yield and the need for additional N.
In some years, there will be minimal amounts of N needed, while in others there will be significant quantities required for maximum yield. Why should we apply the same rate each year when the yields are different? Why should we apply the same rate each year when the environment delivers (for free) totally different amounts and that impact the rate required from mid-season N applications.
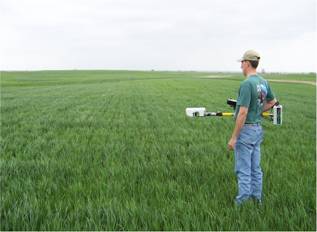
In the picture above, Jason Lawles inspects the Nitrogen Rich Strip (left) compared to the normal farmer practice (right). In this case, the NDVI reading on the left was 0.75, and the NDVI reading on the right was 0.61. The response index of 1.23 (0.75/0.61 = 1.23) indicates that we could achieve a 23% increase in yield if added N fertilizer is applied. The topdress N rate is determined by computing N uptake in the N Rich Strip minus N uptake in the farmer practice, divided by an efficiency factor. All of this is done automatically on the SBNRC web site (listed above) and that reports both the projected wheat grain yields (based on these readings and when the crop was planted) and the optimum topdress fertilizer N rate.
Even if you do not have access to a GreenSeeker Hand-Held sensor, you need to apply your Nitrogen Rich Strip preplant (or soon thereafter) in each and every field, and to use the difference between the Nitrogen Rich Strip and your conventional practice to determine how much N the environment delivered and whether or not you should apply fertilizer N. If you cannot see the difference between the Nitrogen Rich Strip and your conventional practice (visual interpretation from January to March), you are unlikely to obtain any benefit from mid-season fertilizer N.
What we do know is that the amount of N required from one year to the next changes drastically. Our long-term experiments clearly show that in some years, less than 20 lbs of fertilizer N/ac can be required for maximum yields, while in others 120 lbs of N/ac is needed. Furthermore, if excess N is applied one year, it has limited impact on the demands for N the subsequent year. In other words, we need to re-determine the mid-season fertilizer N rate each and every year.
In general, how much N should I apply preplant for my Nitrogen Rich Strip?
Grain
Yield N Rich Strip
20 50
30 75
40 100
50 125
60 150
70 175
If you are also soil testing, the amount of N in the soil test (NO3-N) should be subtracted from these recommended amounts. If you have a forage + grain production system, these preplant N rates for your N Rich Strip should be increased by 20 to 30%. There is no fixed recommendation, but rather you should use common principals to arrive at a rate where N will not be limiting throughout the season. Farmers are not going to take the risk of applying the rate for a N Rich Strip to their entire field, simply because on average it will not pay. What the N Rich Strip does is it serves as a guide to how much topdress N should be applied to maximize yields, taking into account how much the environment delivered for free.
What if I did not get the N Rich Strip out Preplant
Putting out your N Rich Strip as late as the end of December is probably OK, but the best mid-season fertilizer N rates are going to be determined from N Rich Strips that were put out at planting or soon thereafter.
Where should I put the N Rich Strip
In general, we recommend placing the N Rich Strip in the middle of the field, applied over the entire length. Also, the starting point should be somewhere close to a drive-by road, thus allowing visual inspection on a daily basis.
Where do I go with Questions
You can consult our Nitrogen Use Efficiency Web site (www.nue.okstate.edu ) or you can give us a call at OSU.
What can I expect from Using this Technology
This method will allow you to determine the ideal topdress N rate. Over the years we have seen that this is worth over $10.00 per acre. All you have to do is put out your N Rich Strip and use it as a guide for mid-season N fertilization. When fertilizers are applied in excess of that needed for maximum yields, the potential for surface and subsurface nitrate contamination of water supplies increases.
Do you have an example of the Sensor Based N Rate Calculator and what I should do?
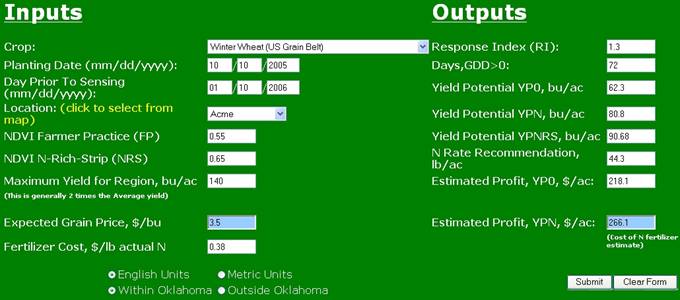
First, using the winter wheat option on the Sensor Based N Rate Calculator (http://www.soiltesting.okstate.edu/SBNRC/SBNRC.php), using the Within Oklahoma option, you have to do the following:
1. Enter your planting date.
2. Enter the day prior to sensing (again, the day prior to sensing is necessary because this calculator relies on weather data from the Oklahoma MESONET that does not include the current day.
3. Enter your location, or click from the Oklahoma map to identify the MESONET station closest to your farm.
4. Collect GreenSeeker NDVI readings (200 or more feet) from the Farmer practice (this would be from an area in the field adjacent to where you placed the N Rich Strip, and that was representative of the rest of your field).
5. Collect GreenSeeker NDVI readings (200 or more feet) from the N Rich Strip, adjacent to the area where you collected NDVI for your Farmer Practice.
6. For both #4 and #5, these values need to be collected within each and every field. Even if two adjacent fields differed in planting dates by only 2 days (or sensing dates), the N recommendation is likely to be different.
7. The Maximum Yield for the Region is generally 2 times greater than the average for a field, but can be as great as 3 times the average. The need for this input is to avoid fertilizing for unrealistic yields.
8. The expected price you hope to obtain for your wheat grain (when you sell or harvest it) should be entered, along with the price of fertilizer you are having to pay per pound of N at the time of N fertilization. These two values are used to estimate gross profits (on the right hand side) using the estimated yield levels with and without N fertilization (at the rate recommended) accounting for how much N was applied at the entered price values.
9. OUTPUTS: The Response index is essentially the NDVI of the N Rich Strip divided by the NDVI of the farmer practice. If this is 1.3, it says that you can achieve a 30% increase in yield if you fertilize, but by itself does not provide you with the N rate that should be applied.
10. If you entered with Within Oklahoma option, it takes the date of planting and the sensing date (1 day prior) and looks up from the Oklahoma MESONET the # of days from planting to sensing where GDD >0. GDD or growing degree days is computed as daily (Tmin + Tmax)/2 - 40F. This essentially determines the # of days where average temperatures were > 40F, or where growth was possible. This is important in winter wheat, because many days in the winter wheat cycle have low temperatures and growth does not take place. NDVI is essentially an estimate of biomass, thus biomass accumulated per # of days where growth was possible is growth per growing day or growth rate. This value is an excellent estimate of mid-season yield potential.
11. YP0 (yield potential without applying additional N) and YPN (projected yield to be obtained if the farmer applies the recommended fertilizer N rate listed) are estimates of wheat grain yield (or other crops, depending on the algorithm used) based on the data provided by farmers from each field on the INPUT side of the Sensor Based N Rate Calculator. If growth continues in the same fashion as that encountered from planting to sensing, we have ample data to confirm that these estimates of yield potential are very accurate.
12. Using the estimate of yield potential, the yield obtainable if N is applied is determined by multiplying YP0 times an adjusted RI (usually a bit higher than the estimated RI, based on collected data). The N rate recommended is simply the difference in grain N uptake for YPN and YP0 divided by an efficiency factor of 0.60. The reason for using 0.60 is simply because topdress N applications will seldom encounter an N use efficiency greater than 0.60.
13. Again, the estimated gross profits listed employ the grain and fertilizer prices and the estimates of yields obtainable with and without N fertilizer. This decision making tool often provides farmers with a yes or no answer of whether or not it will pay to apply fertilizer N (for that season), and if so, how much.
14. Use this methodology and you can add $10.00 per acre to your profit margin! It is that simple.
Various terms used in sensor based technology.
__________________________________________________________
NDVI: normalized difference vegetative index, = (NIR-red)(NIR+red).
Yield potential: estimated optimum yield that a farmer can obtain based on growing conditions from planting to the time of sensing. This is yield potential, not yield and essentially replaces yield goals. NDVI estimates biomass, and we divide NDVI by the # of days from planting to sensing which is an estimate of biomass produced per day. This is growth rate and that is correlated with final yield potential.
Response Index: This is estimated using NDVI from the N Rich strip divided by NDVI from the farmer practice. NDVI is measured using the GreenSeeker sensor. This is an estimate of the responsiveness to applied N that a farmer is likely to encounter and that varies from year to year in the same field. Why? Because the environment delivers a lot of N for free some years (warm, wet winters where a lot of N is mineralized from soil organic matter, and N deposition in rainfall). Why apply N if it is not needed and the environment delivered a lot for free? Stop asking why, get your N Rich Strip out and save yourself > $10/acre/year.
Radiance: the rate of flow of light energy reflected from a surface.
Wavelength: distance of one complete cycle
Frequency: the number of cycles passing a fixed point per unit time
l = c/v
l is the wavelength in cm
v is the frequency in sec-1 or hertz (Hz)
c is the velocity of light (3x1010 cm/sec)
Electromagnetic radiation possesses a certain amount of energy. The energy of a unit of radiation, called the photon is related to the frequency by
E = hv = hc/l
E is the energy of the photon in ergs
h is Planck's constant 6.62 x 10⁻²⁷ erg-sec
The shorter the wavelength or the greater the frequency, the greater the energy. Energy of a single photon (E) is proportional to its frequency (v) or inversely proportional to its wavelength.
__________________________________________________________
Agronomy Journal, 91:357-363