Example File (Morrison)
Example Data (Salmon) below
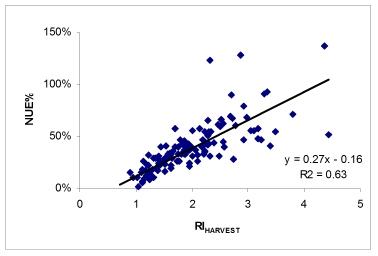
Relationship between RI (determined at harvest) and the nitrogen use
efficiency observed over time, Experiment 502, 1971-2005.
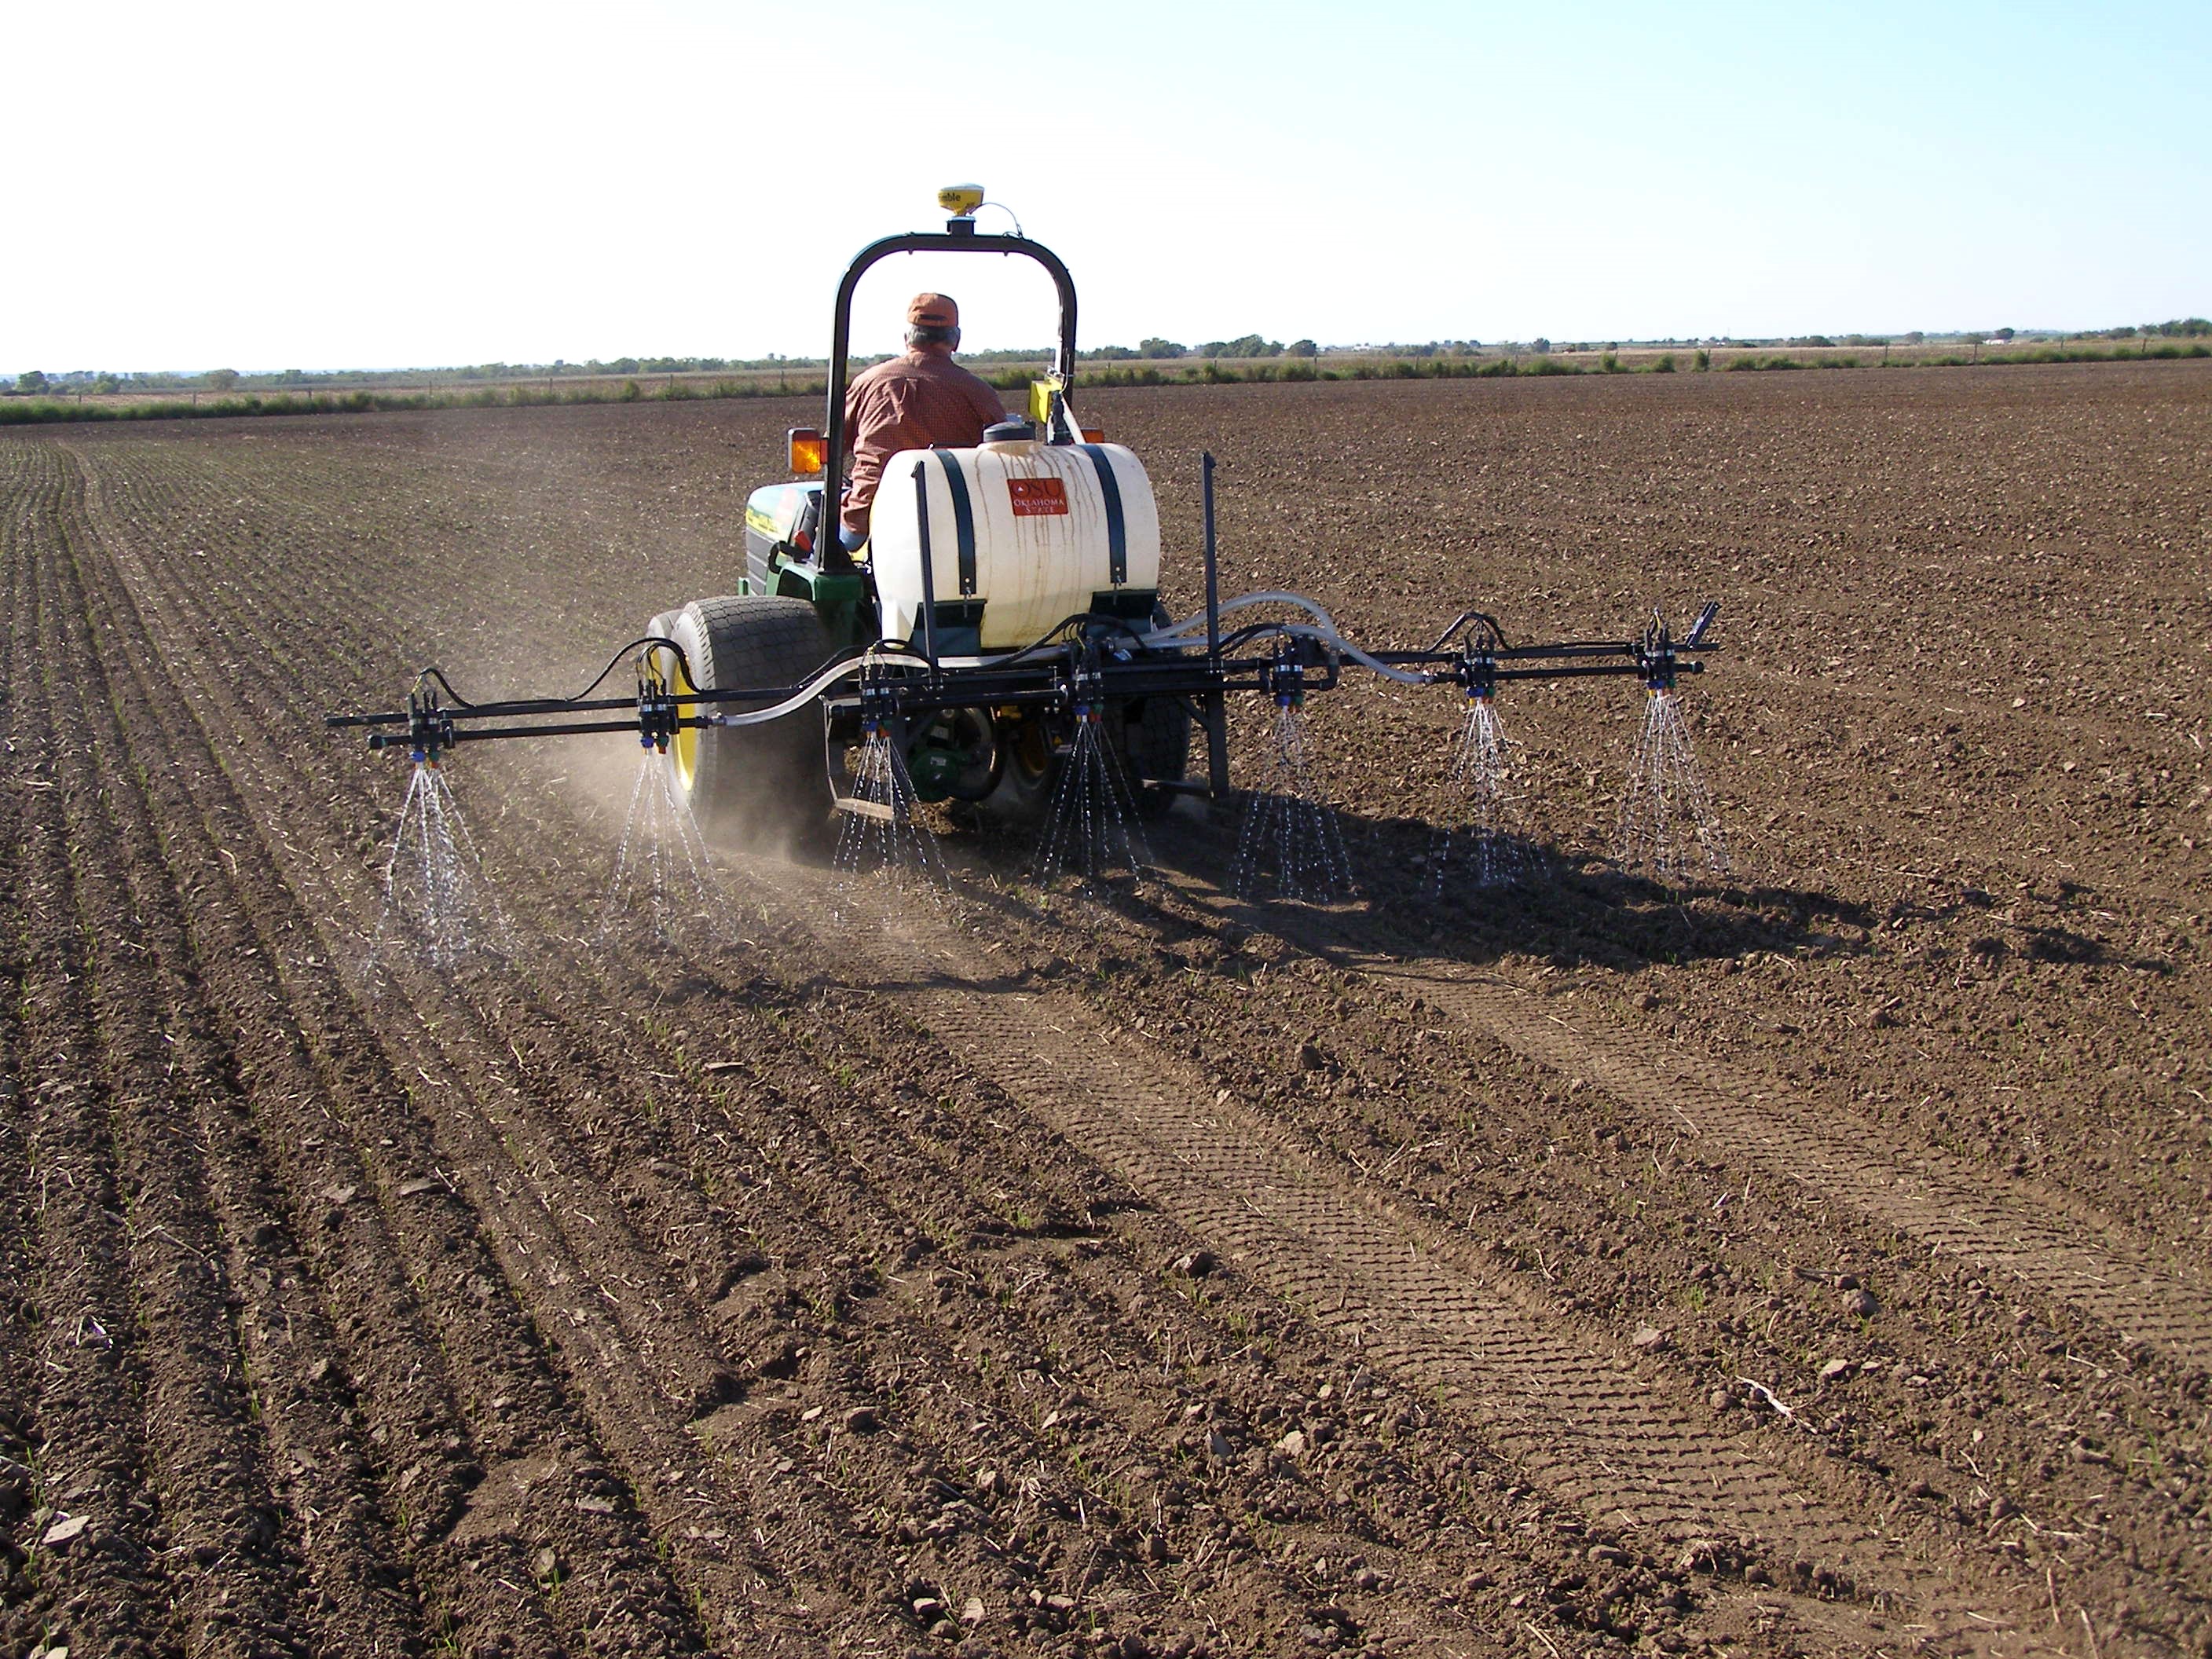
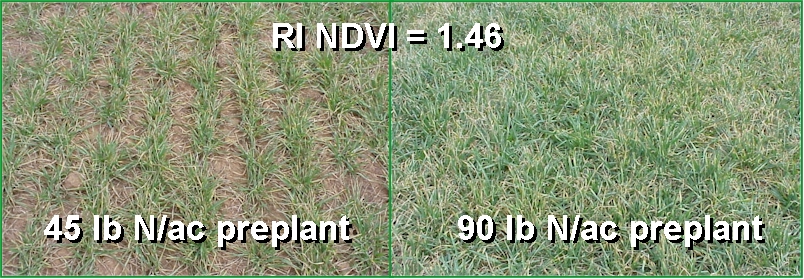
The relationship between RI NDVI and the final N recommendation using SBNRC is listed above.
 The
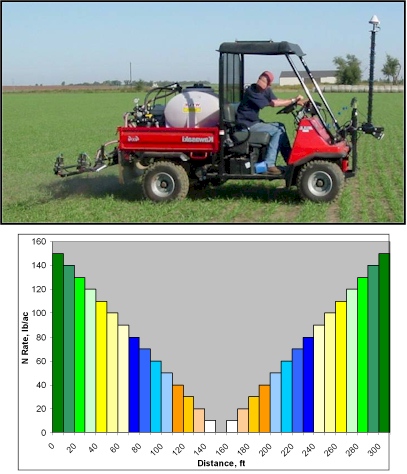
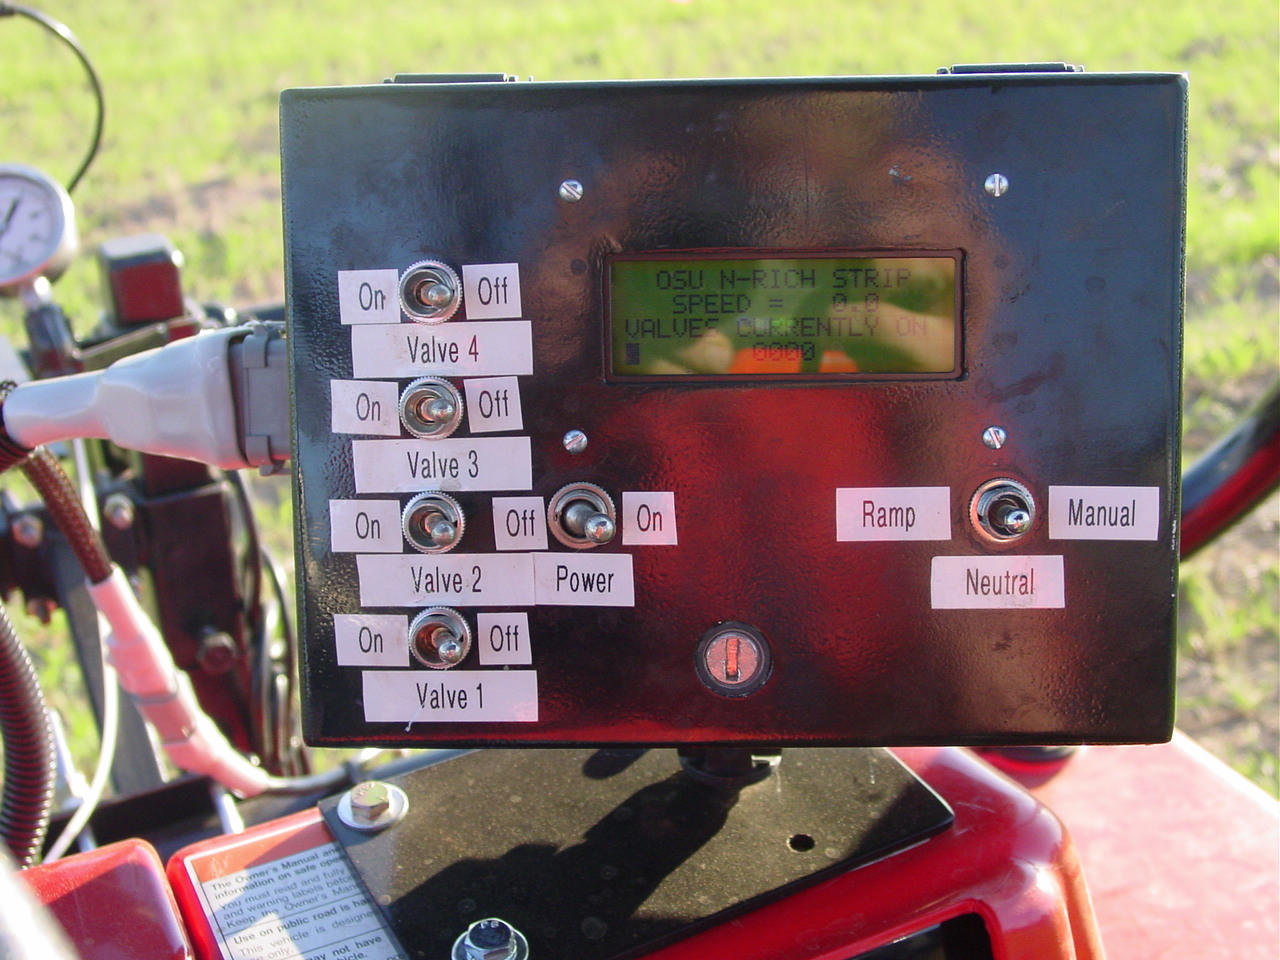
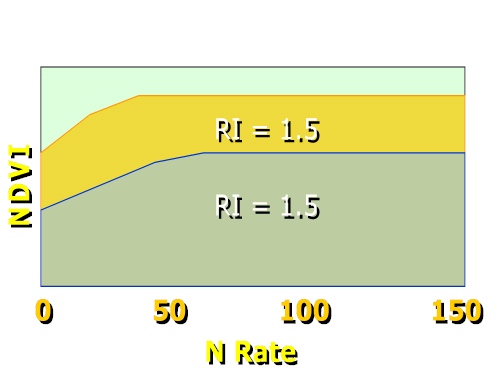
Ramped N Reference Strip will allow researchers to refine mid-season
fertilizer N rates by knowing exactly what the RI was (NDVI Max, divided by
NDVI Min), and by integrating the area under the curve over the distance
included within the ramp (currently set at 150 feet, but than can be altered
to increased rate change intervals).
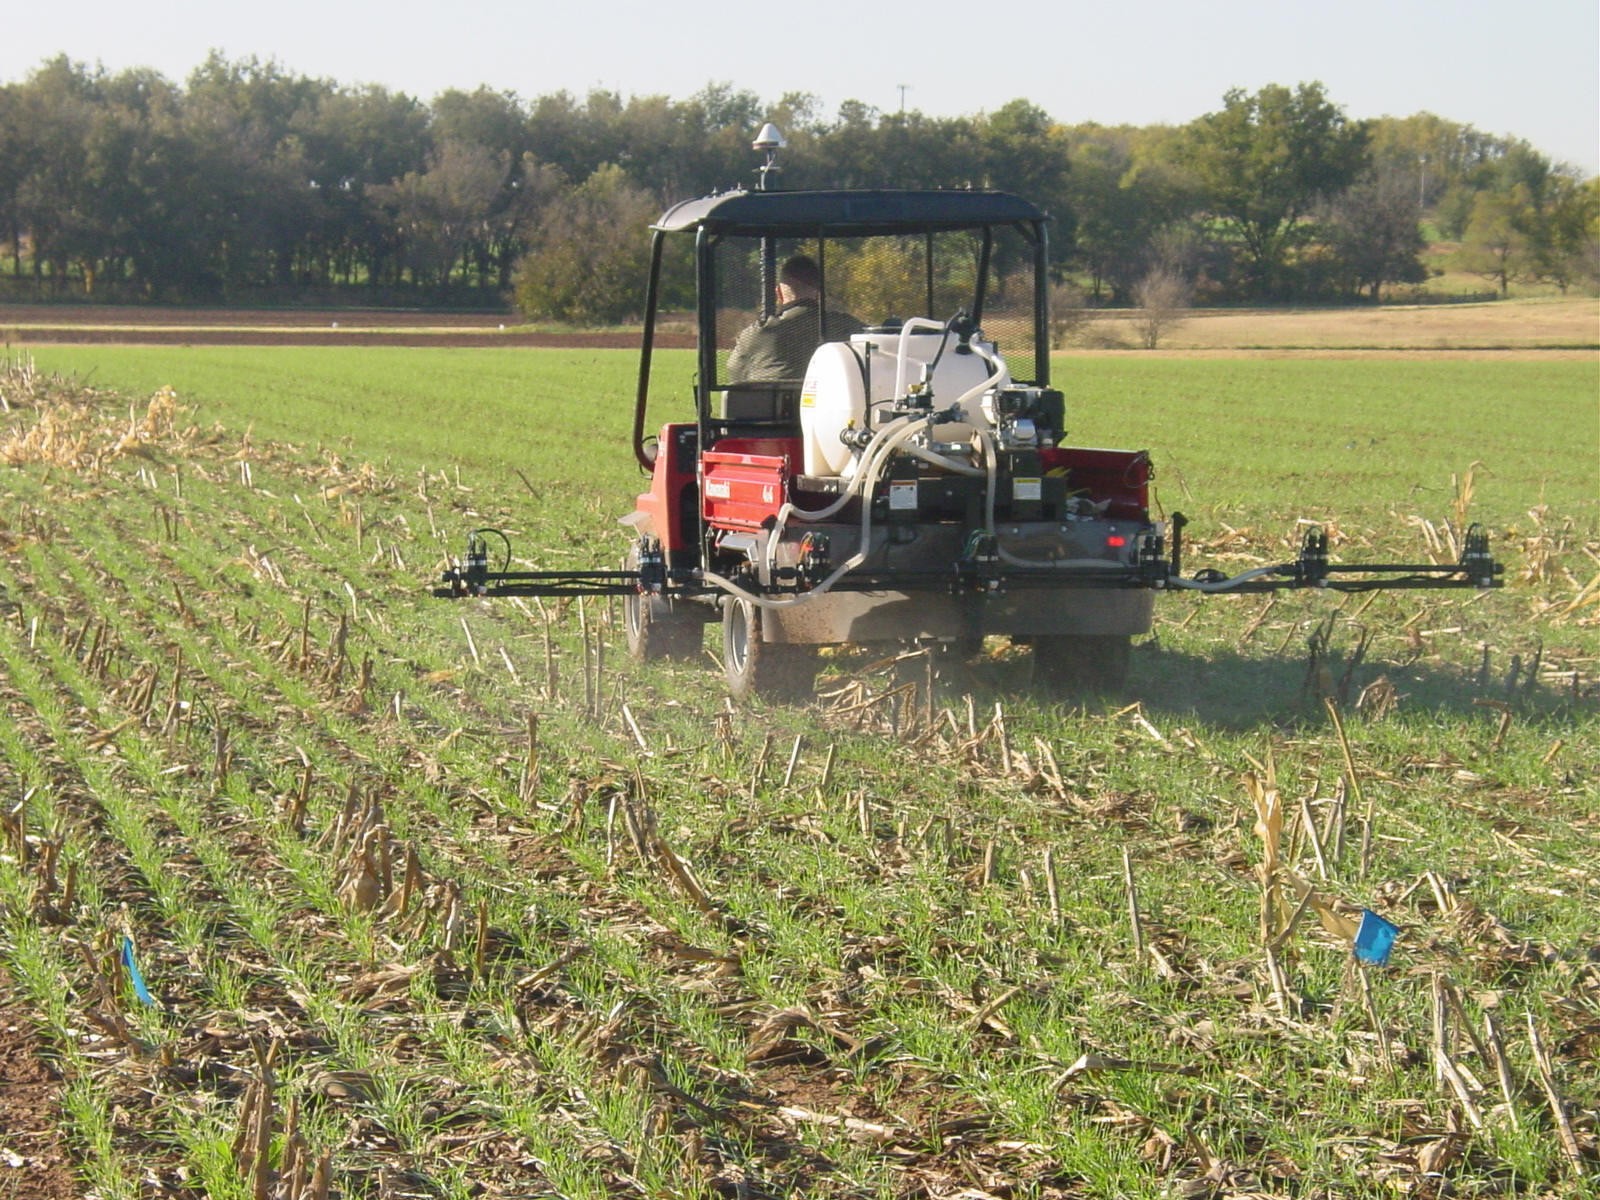
The
Ramped N Reference Strip will allow researchers to refine mid-season
fertilizer N rates by knowing exactly what the RI was (NDVI Max, divided by
NDVI Min), and by integrating the area under the curve over the distance
included within the ramp (currently set at 150 feet, but than can be altered
to increased rate change intervals).
 Click
on the Question to See the VIDEO.
Click
on the Question to See the VIDEO.Tom Denker, Farmer near Enid, OK
Question: What is the benefit of GreenSeeker Technology?
Question: What do you think about OSU working with private industry to make this type of technology available to producers?
Question: Would you like to add anything?
Jerrel Powell, Farmer near Council Hill,
OK
Question: How have you used GreenSeeker
Technology?
Question: Why is Nitrogen Important?
Question: What would you like to tell
producers in OK about GreenSeeker Technology?
_files/Obregon2003_farmer.jpg)
Wheat farmer in Ciudad Obregon, Mexico displays on his right hand (3, for 300 kg urea applied preplant) and on his left hand (0, for 0 kg urea applied preplant). The N rich strip and response index indicated that NO topdress N should be applied. The farmer was elated.
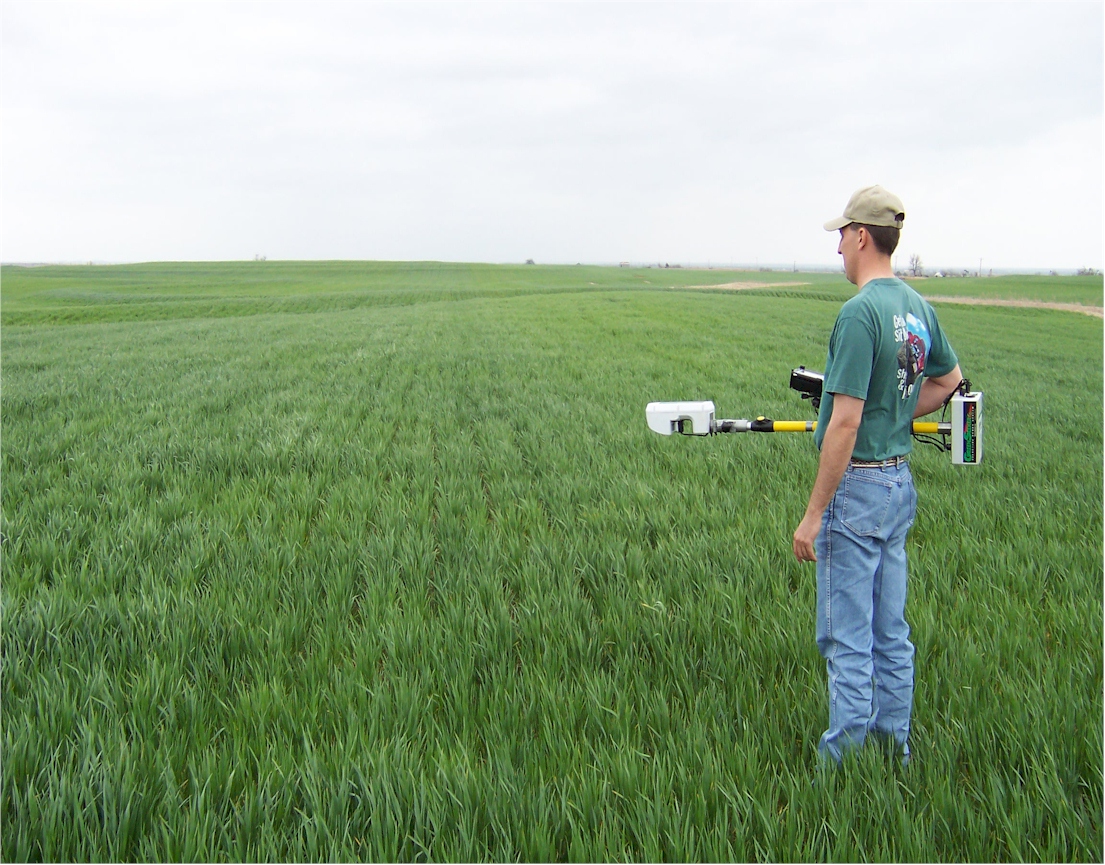
Loy Marshall, N Rich STrip on Left (RI = 1.38 at this site). Jason Lawles (NTech Industries, www.ntechindustries.com ) inspects the N Rich Strip prior to taking NDVI sensor readings.
Managing N Fertilizer Using a N-Rich-Strip: Projected Profitability
62 locations in Oklahoma, 1998-2003