 Calibration Stamp Technology
Video Link Coming Soon
 Research Article Documenting the
Application of the Calibration Stamp:
Research Article Documenting the
Application of the Calibration Stamp:Automated Calibration Stamp Technology for Improved In-Season Nitrogen Fertilization Agronomy Journal (in press)
Calibration Strip Sprayer (David Zavodny)
Precision Ag Update, CCA 2005 (J. Solie)
 Oklahoma
State University recently released the first automated calibration stamp
applicator for improving in-season fertilizer N rates and ultimate
Nitrogen Use Efficiency.
Oklahoma
State University recently released the first automated calibration stamp
applicator for improving in-season fertilizer N rates and ultimate
Nitrogen Use Efficiency.
Abstract
Accurate determination of mid-season fertilizer N rates for cereal
production is complicated. Mid-season fertilizer N is currently
recommended using a wide range of soil-test and soil-N mineralization
procedures, with no fundamental scientific agreement anywhere in the world
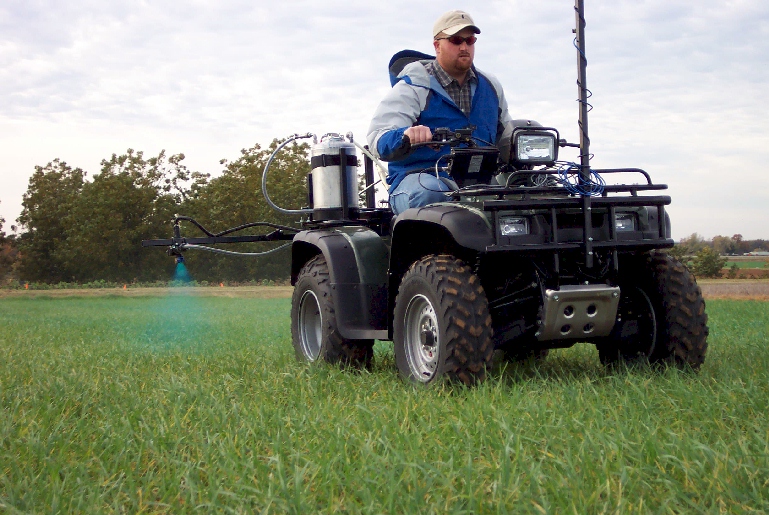
on the methodology. A conventional 2003 Honda FourTrax Foreman ES
4-wheeler (433cc, 127cm wheel base, 116cm wide) with a 3 m wide spray boom
and a 1 m spacing between nozzles was modified to deliver a range of fixed
N rates as urea ammonium nitrate (28%N) within a 9m2 grid.
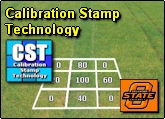
Within each grid, 9 separate 1m2 areas exist, whereby each of
the 4 corners receive no fertilizer N. Rates of 22, 45, 67, 90, and 112
kg N ha-1 occupy the other 5, 1m2 areas within the
9m2 grid (termed as an N rate calibration stamp). Traveling
at 5 mph, consecutive 9m2 grids can be applied continuously.
The calibration stamps should be applied preplant and superimposed on top
of the farmer practice. By mid-season, differences between the 1m2
N rate areas can be visualized and a field-specific topdress N rate
can be prescribed by choosing the lowest N rate where no visual
differences were observed between it and the next highest rate. Using
preplant or early-season applied calibration stamps, topdress N rates can
be determined that precisely account for N mineralization, and atmospheric
N deposition from planting to the time mid-season N is applied.
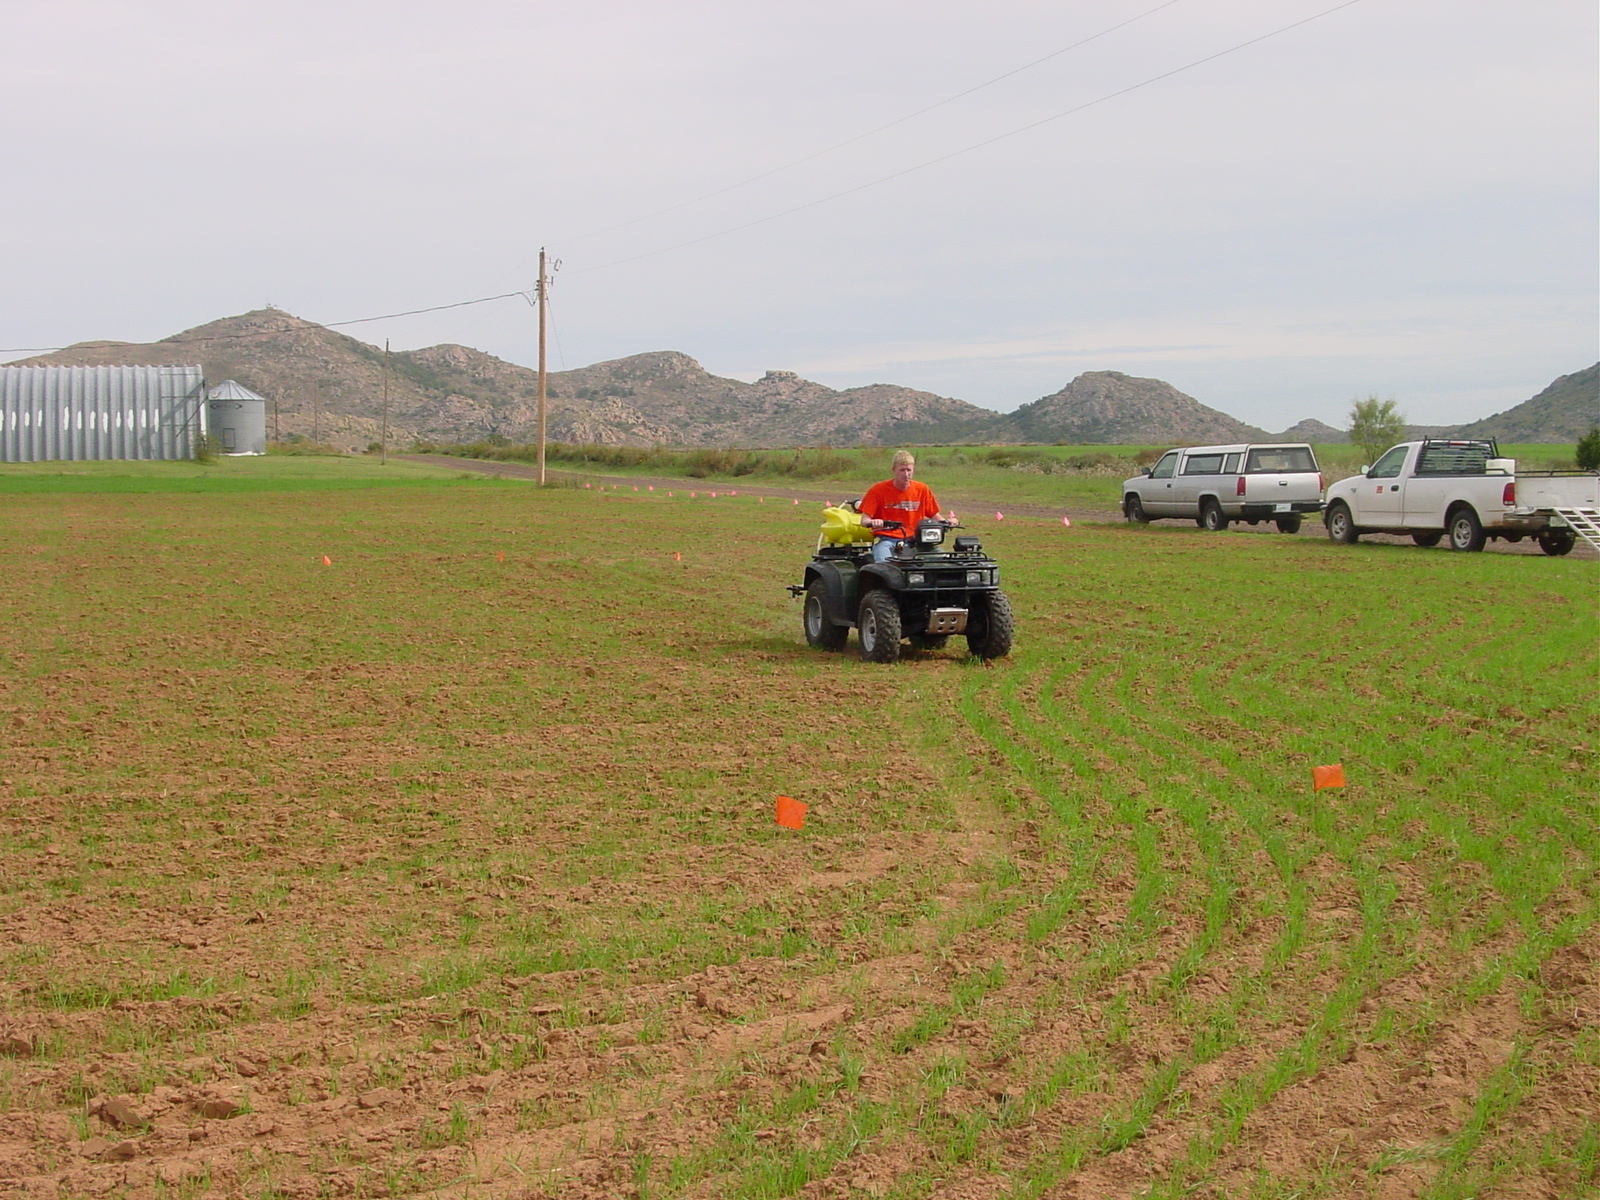
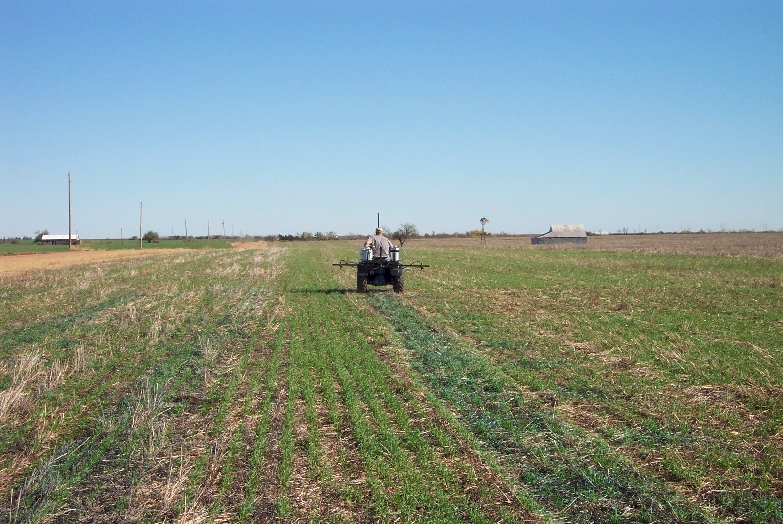
Clint Mack prepares to apply calibration stamps in Western Oklahoma
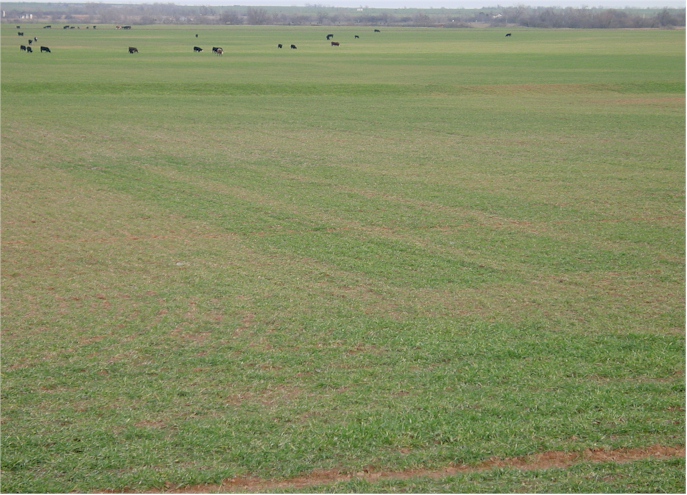
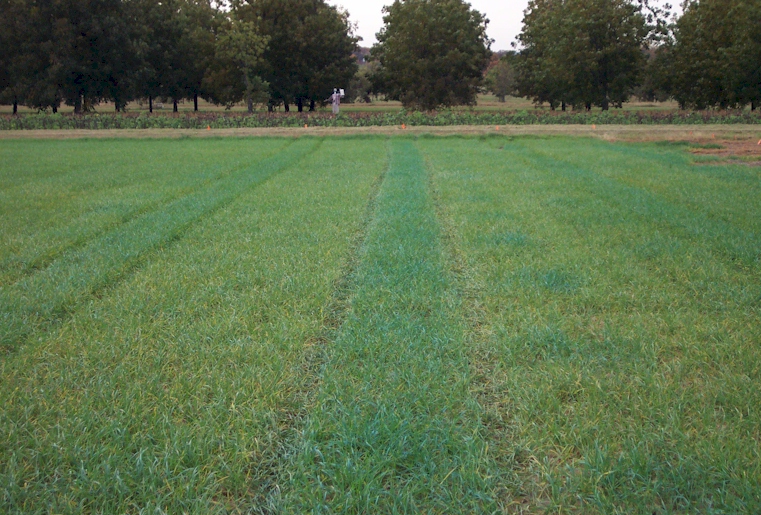
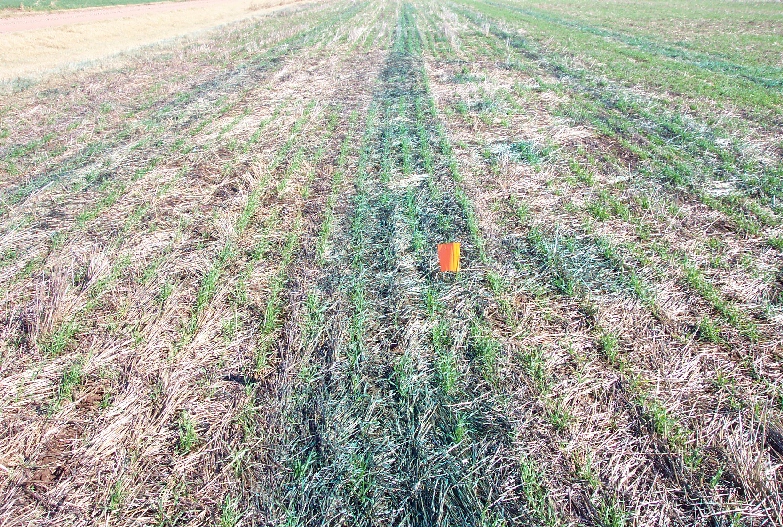
Calibration Stamp in Western Oklahoma showing the 3 strips with decreasing N rates.
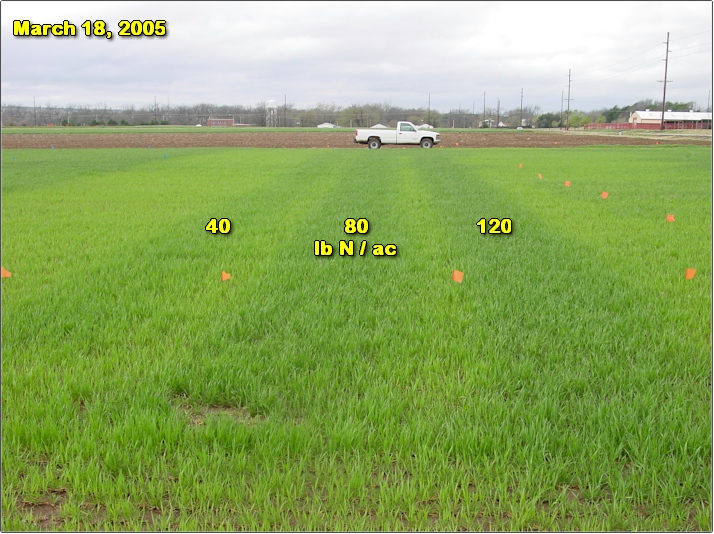
Calibration Strips applied just north of Experiment #222, fall 2004, read on March 18, 2005
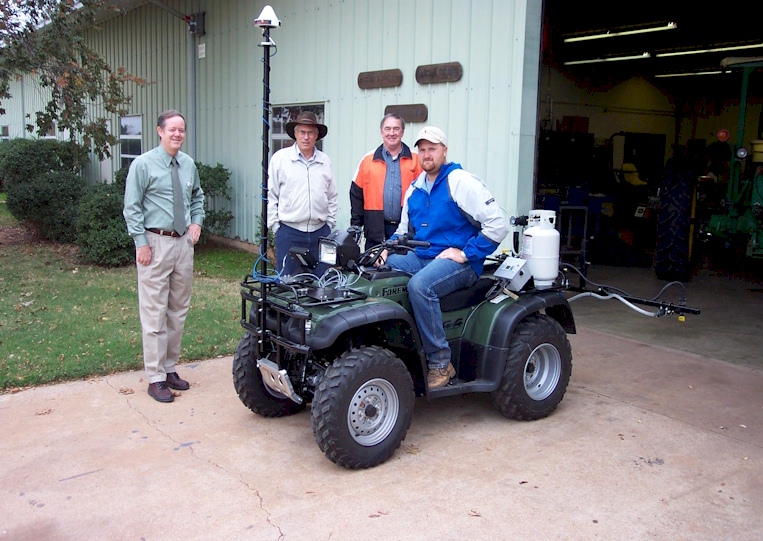
Dr. Marvin Stone, Dr. John Solie, David Zavodny, and Kyle Freeman stand in front of the very first CST applicator.

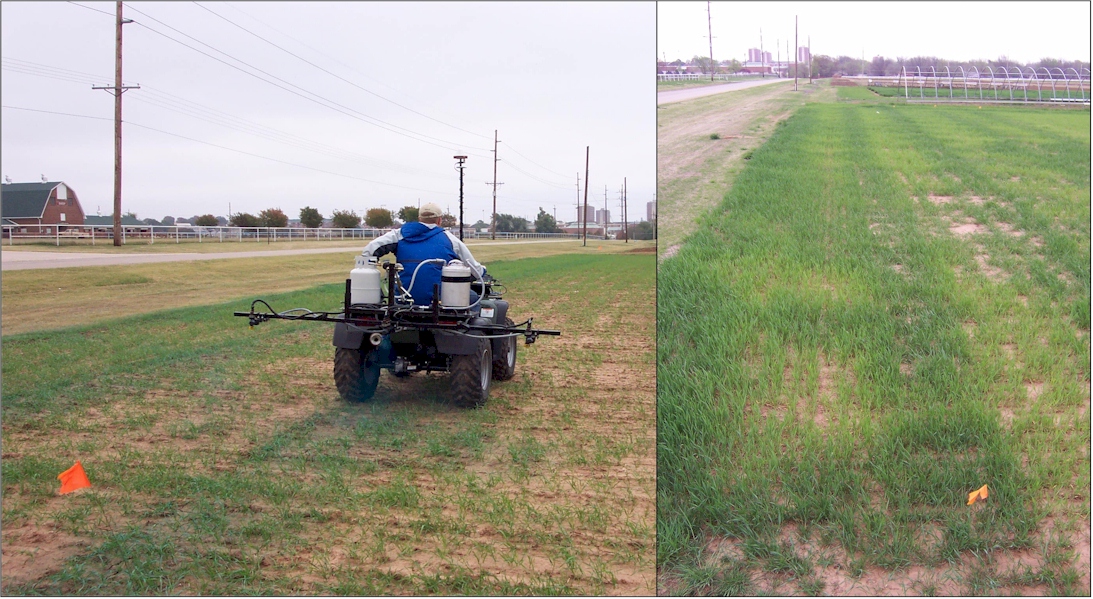
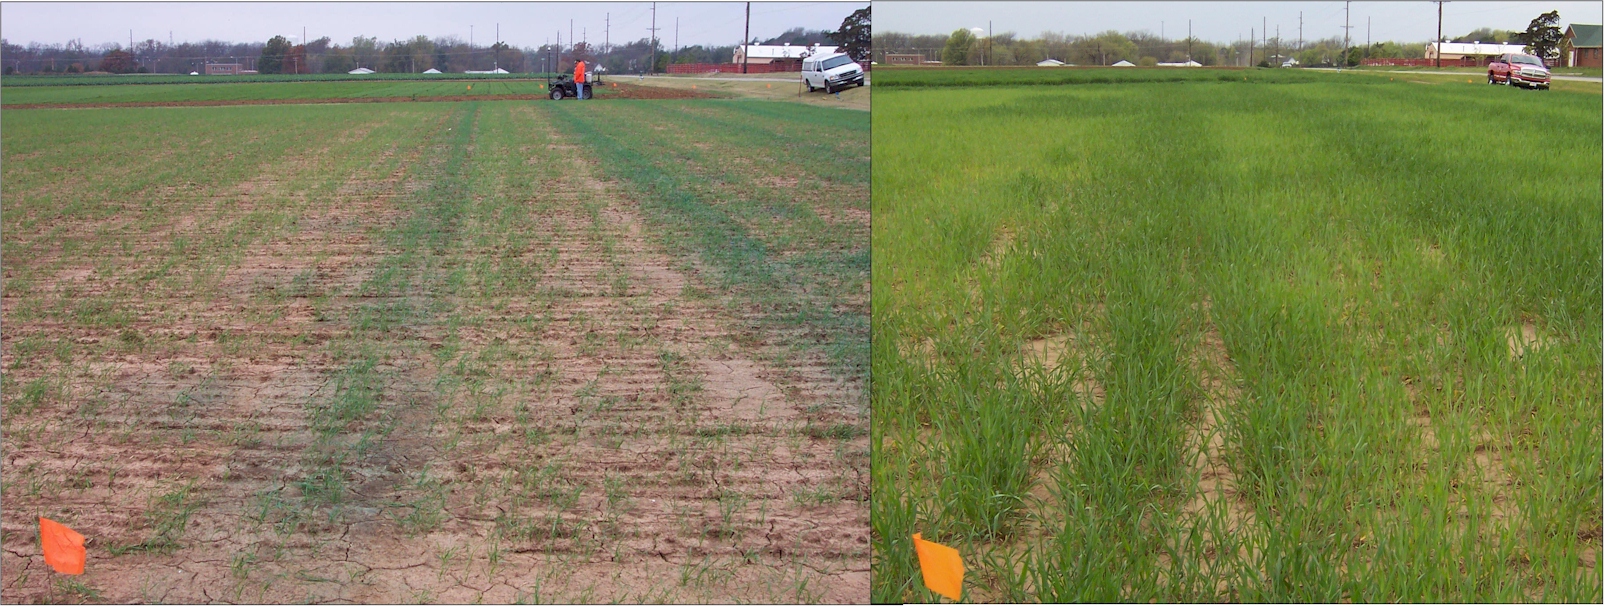
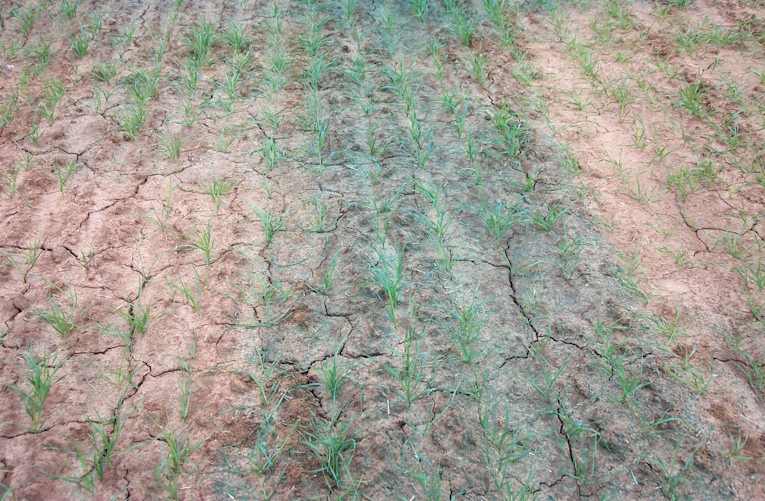
Figures (above and below). Calibration stamps applied soon after planting (left) and visual stamp differences mid-season (right) that are used to prescribe accurate mid-season N fertilizer rates.
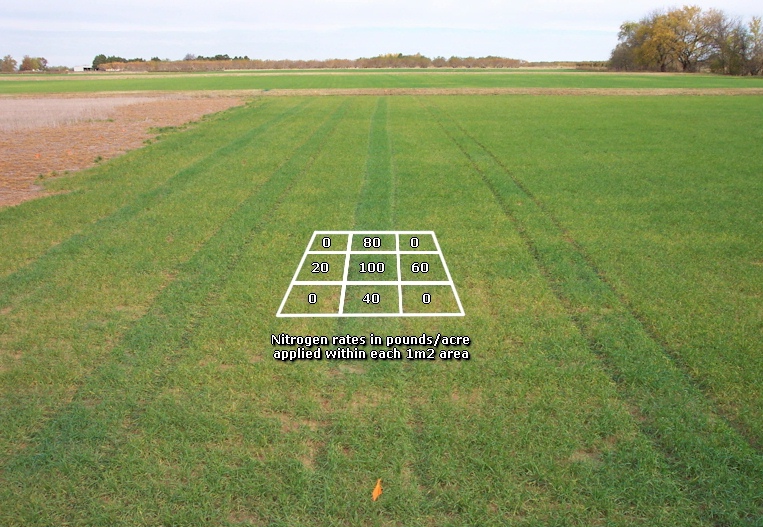
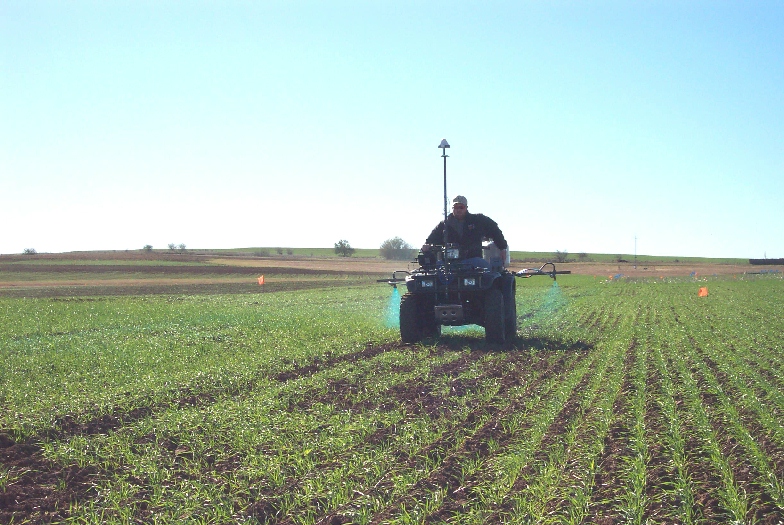
Continuous calibration stamps (9m2) applied at Perkins, OK on top of winter wheat at Feekes growth stage 4, and superimposed schematic of actual N rates in kg N/ha using urea ammonium nitrate applied as a foliar spray.
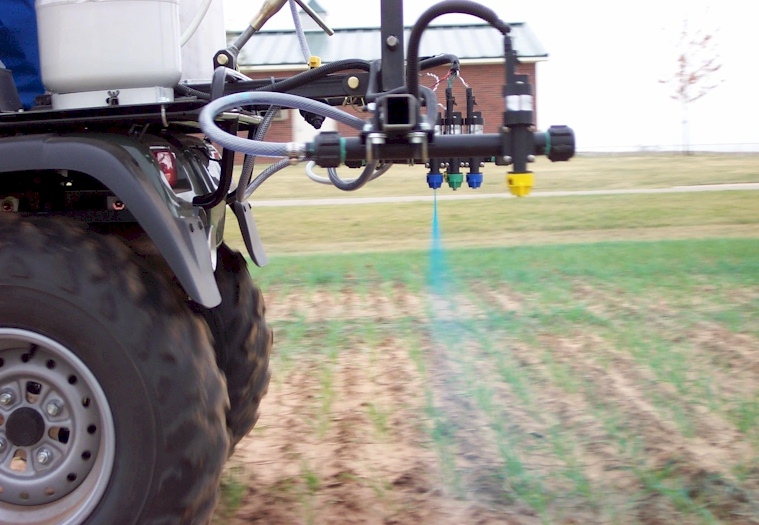
UAN with Blue Dye applied soon after wheat planting such that calibration stamps can be visualized by cooperators/farmers.
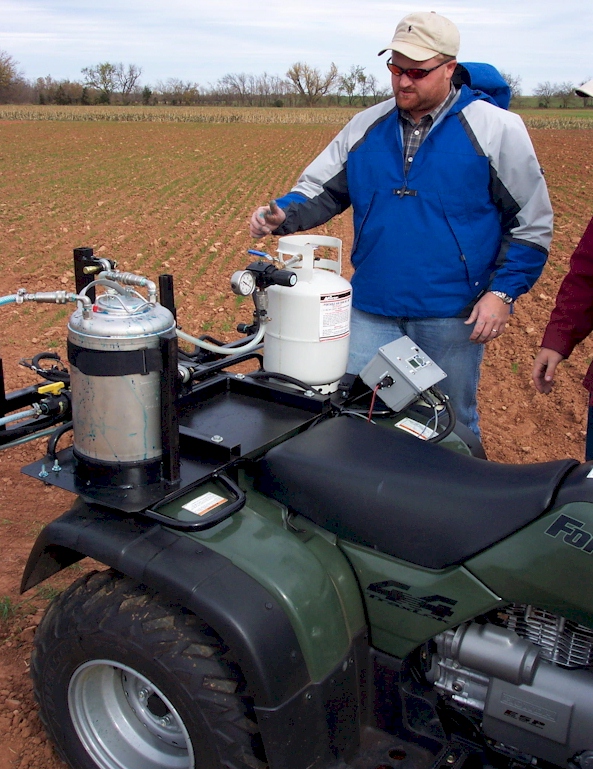
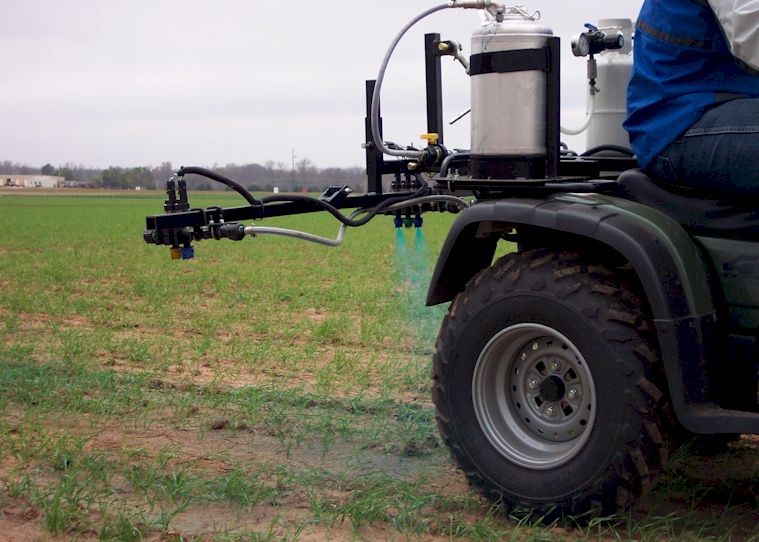
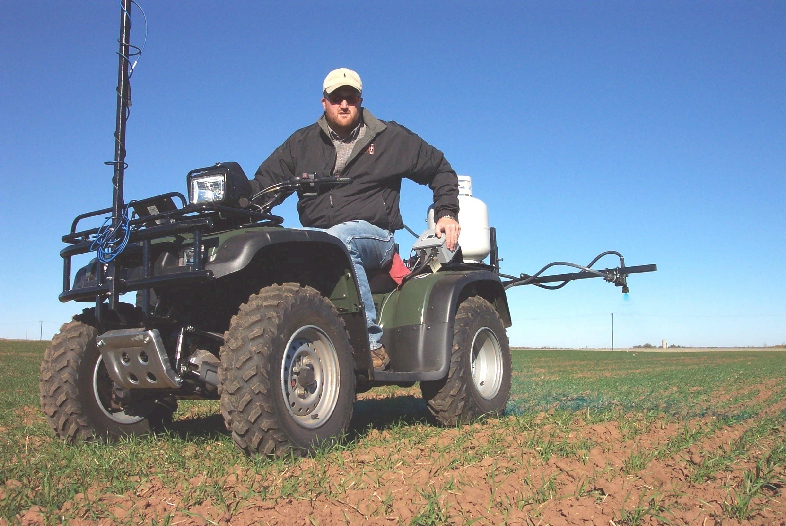
Kyle Freeman and Brian Arnall adjust the air pressure for the spraying system that requires 30 PSI. Next to his left hand is the controller which can be operated with 3 switches (power, purge, and spray). The controller automatically cycles if the spray button is held down. Each cycle includes a stamp with 9 squares (4 checks of 0, and one each of 20, 40, 60, 80, and 100 lbs N/ac). Each square measures 1 x 1 m, while the entire stamp measures 3 x 3 m.
Prior to putting out the calibration stamps, Kyle Freeman purges the system with UAN.
