 Power RI
The Power Response Index will integrate the area underneath the curve (NDVI as a function of distance). The same RI's can be obtained using lower values and higher values, but the area under the response curve will further characterize response.
N rates will be applied in proportionately
increasing rates across a distance of 100 feet. Each foot will
represent 1 lb N/ac increase. Mid-season N rates for optimum profit
will be the distance where no change in NDVI was detected between it and a
higher rate.
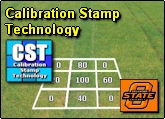 Research Article Documenting the
Application of the Calibration Stamp:
Research Article Documenting the
Application of the Calibration Stamp:Automated Calibration Stamp Technology for Improved In-Season Nitrogen Fertilization Agronomy Journal (in press)
Calibration Strip Sprayer (David Zavodny)
Precision Ag Update, CCA 2005 (J. Solie)
