
|
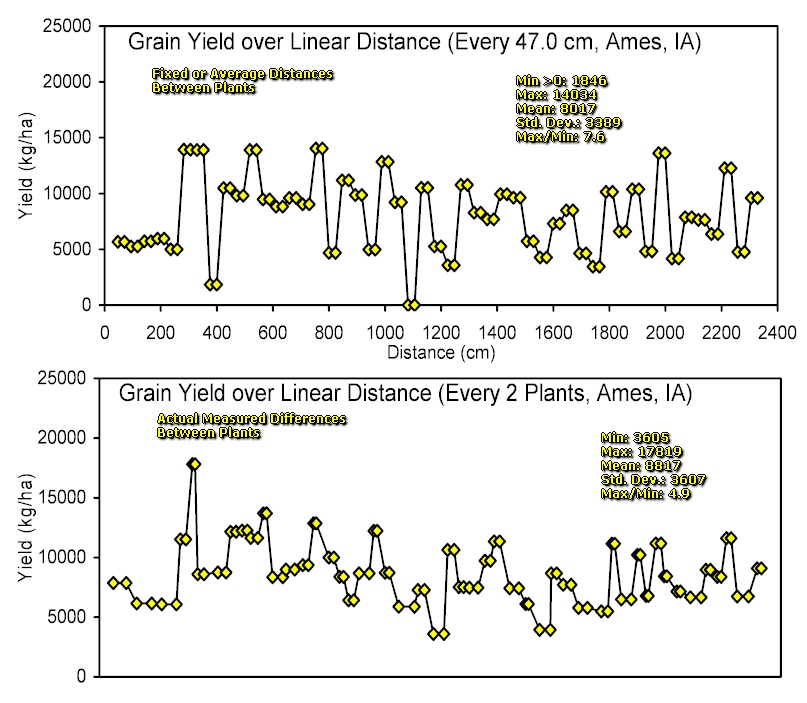
| Plant to Plant Variability using Fixed Distances and Actual Distances |
|
For the example below, grain yields were determined using
a fixed distance
between plants (top graph), and the actual distances (bottom graph). For
the fixed example, the total number of plants was divided by the total distance
in the row, and an average or fixed distance thus computed. The standard
deviation for both methods was greater than 3389 kg/ha (54 bu/ac).
Extrapolating by-plant grain weights to "g/m2" or "kg/ha" results in the exact
same amount of variability when expressed as a percentage of the mean.
What is important to note in the example below is that the differences remained
large whether using a fixed distance or the actual distance. Regardless of the method, grain yields in this transect varied from 29 bu/ac to 223 bu/ac in 70 feet of row. |
 |
| Plant to Plant Variability in Corn Production (in review) |
| By-plant variability in corn grain yield (45 transects) (Included in this study are data from Argentina, Mexico, Nebraska, Iowa, Ohio, Virginia, Oklahoma) |
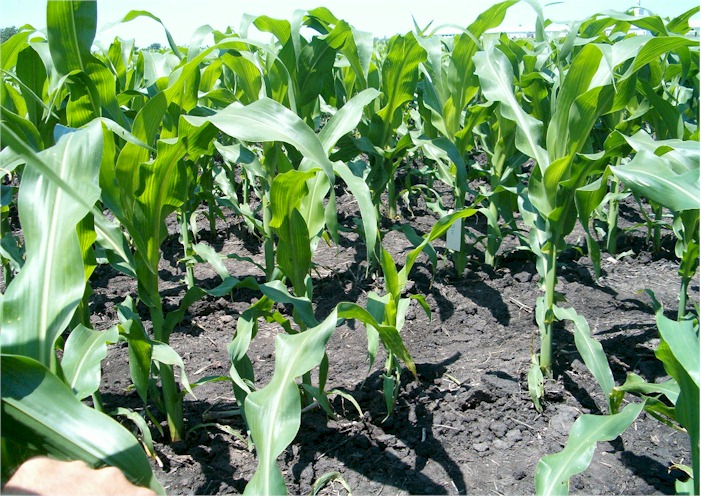 Visual differences in corn growth in this Ames, IA field. |
Return to
 |