 Predicting the Potential Response to
Applied N (Response Index) Using Nitrogen Rich Strips or the
Also see
Ramped Calibration Strips
Predicting the Potential Response to
Applied N (Response Index) Using Nitrogen Rich Strips or the
Also see
Ramped Calibration Strips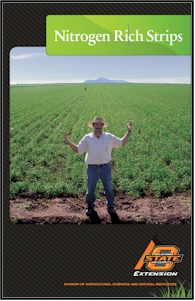
_files/nitrogen_rich.jpg)
Increased NUE for mid-season topdress N rates
The demand for fertilizer nitrogen changes from year to year, even in
long-term plots where the same fertilizer N rates are applied each year.
When winters are wet and warm, sufficient N can be mineralized from soil
organic matter, and enough to nearly meet the demands for maximum yields
(see 1973, 1979, 2001, and 2005)(Figure 1). In these years, this
is compounded by increased N deposition in the rainfall. Our
long-term winter wheat data confirms that the demand for N is variable
from year to year, and that is unpredictable. This exact same
phenomenon was observed in the RC-RS long-term corn experiment conducted
by the late Professor Robert A. Olson at the University of Nebraska
where near maximum yields in the check plot were produced in 1978
(Figure 2). Where did all the N come from if these check plots had
not been fertilized for nearly 10 years? The answer is N
mineralization via an extremely wet and warm spring-summer.
The influence of temporal variability on the need (or lack thereof) for fertilizer N is huge, yet our fertilizer N rate recommendations seldom account for this. Soil testing (NH4-N and NO3-N) works, but when collected preplant, applying a static value on N demands that will become dynamic mid-season, makes no sense. For precisely this reason, we have developed methods that account for the influence of temporal variability on N demands, by making better fertilizer N decisions mid-season when the growing crop can tell us precisely how much N was delivered for free (comparison between the N Rich Strip and the Farmer Practice, mid-season).
The GreenSeeker sensor via NDVI measurements provides a highly accurate estimate of plant biomass, as a result, total N uptake can be estimated from mid-season measurements. More importantly, yield potential can be predicted mid season using both sensor and known climatic data from planting to sensing. By estimating yield, we can then estimate total grain N removed. Yield potential (YP0) is then multiplied times the response index (estimated in-season from NDVI readings collected in the N Rich Strip and Farmer Practice) to obtain the yield obtainable if N fertilizer is to be applied (YPN). The fertilizer N rate is determined by subtracting N uptake at YP0 from N uptake at YPN, and divided by an expected NUE. This entire algorithm is completely delineated in the "Optical Sensor Based Algorithm" article below.
Optical Sensor Based Algorithm
for Crop Nitrogen Fertilization Commun. Soil Sci. Plant Anal.
36:2759-2781 (pdf)
Automated
Calibration Stamp Technology for Improved In-Season Nitrogen
Fertilization
Agron J. 97:338-342. (pdf)
Figure 1. Wheat grain yields in the check (0 kg N/ha) and the N rich (112 kg N/ha) plots, and the associated response index (grain yield N rich, divided by the grain yield in the check) from 1971 to 2007 in the Stillwater 222 long-term winter wheat experiment.
_files/mead.jpg)
Figure 2. Corn grain yields in the check (0 kg N/ha) and the N adequate or N rich (180 kg N/ha) plots, and the associated response index (grain yield N rich, divided by the grain yield in the check) from 1969 to 1983 in the RC-RS long-term corn experiment conducted by Professor R.A. Olson near Mead, Nebraska.
Figure 3.
Wheat grain yields in the check (0 kg N/ha)
and the N rich (112 kg N/ha) plots, and the associated response index (grain
yield N rich, divided by the grain yield in the check) from 1971 to 2010 in
the Lahoma 502 long-term winter wheat experiment.
Relationship between RINDVI and RIHarvest at Feekes 5 across 62 locations in Oklahoma, 1998-2003.
Relationship between the estimated
responsiveness to applied N or response index (RI-NDVI) from sensor
readings (RI-NDVI = NDVI in the N Rich strip divided by the NDVI in the
farmer practice) and the response index determined at harvest (Grain yield
in the N rich strip plot divided by the N Rich strip in the farmer
practice), 2004 Corn Trials. Clearly, the responsiveness to N can be
determined from mid-season sensor measurements collected between V8 and
V9.
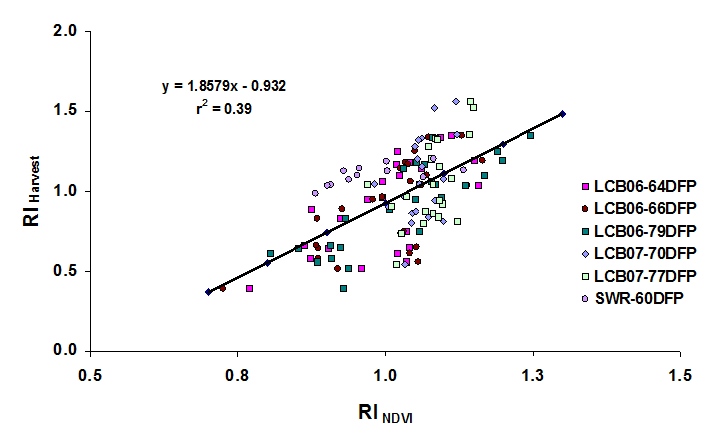
2007: Relationship between the response index measured in season, (NDVI of fertilized plot / NDVI of check plot) from readings of cotton at growth stages from 60 to 80 days after planting, and measured lint yield and the response index measured at harvest (yield of fertilized plot / yield of check plot) from all site years.
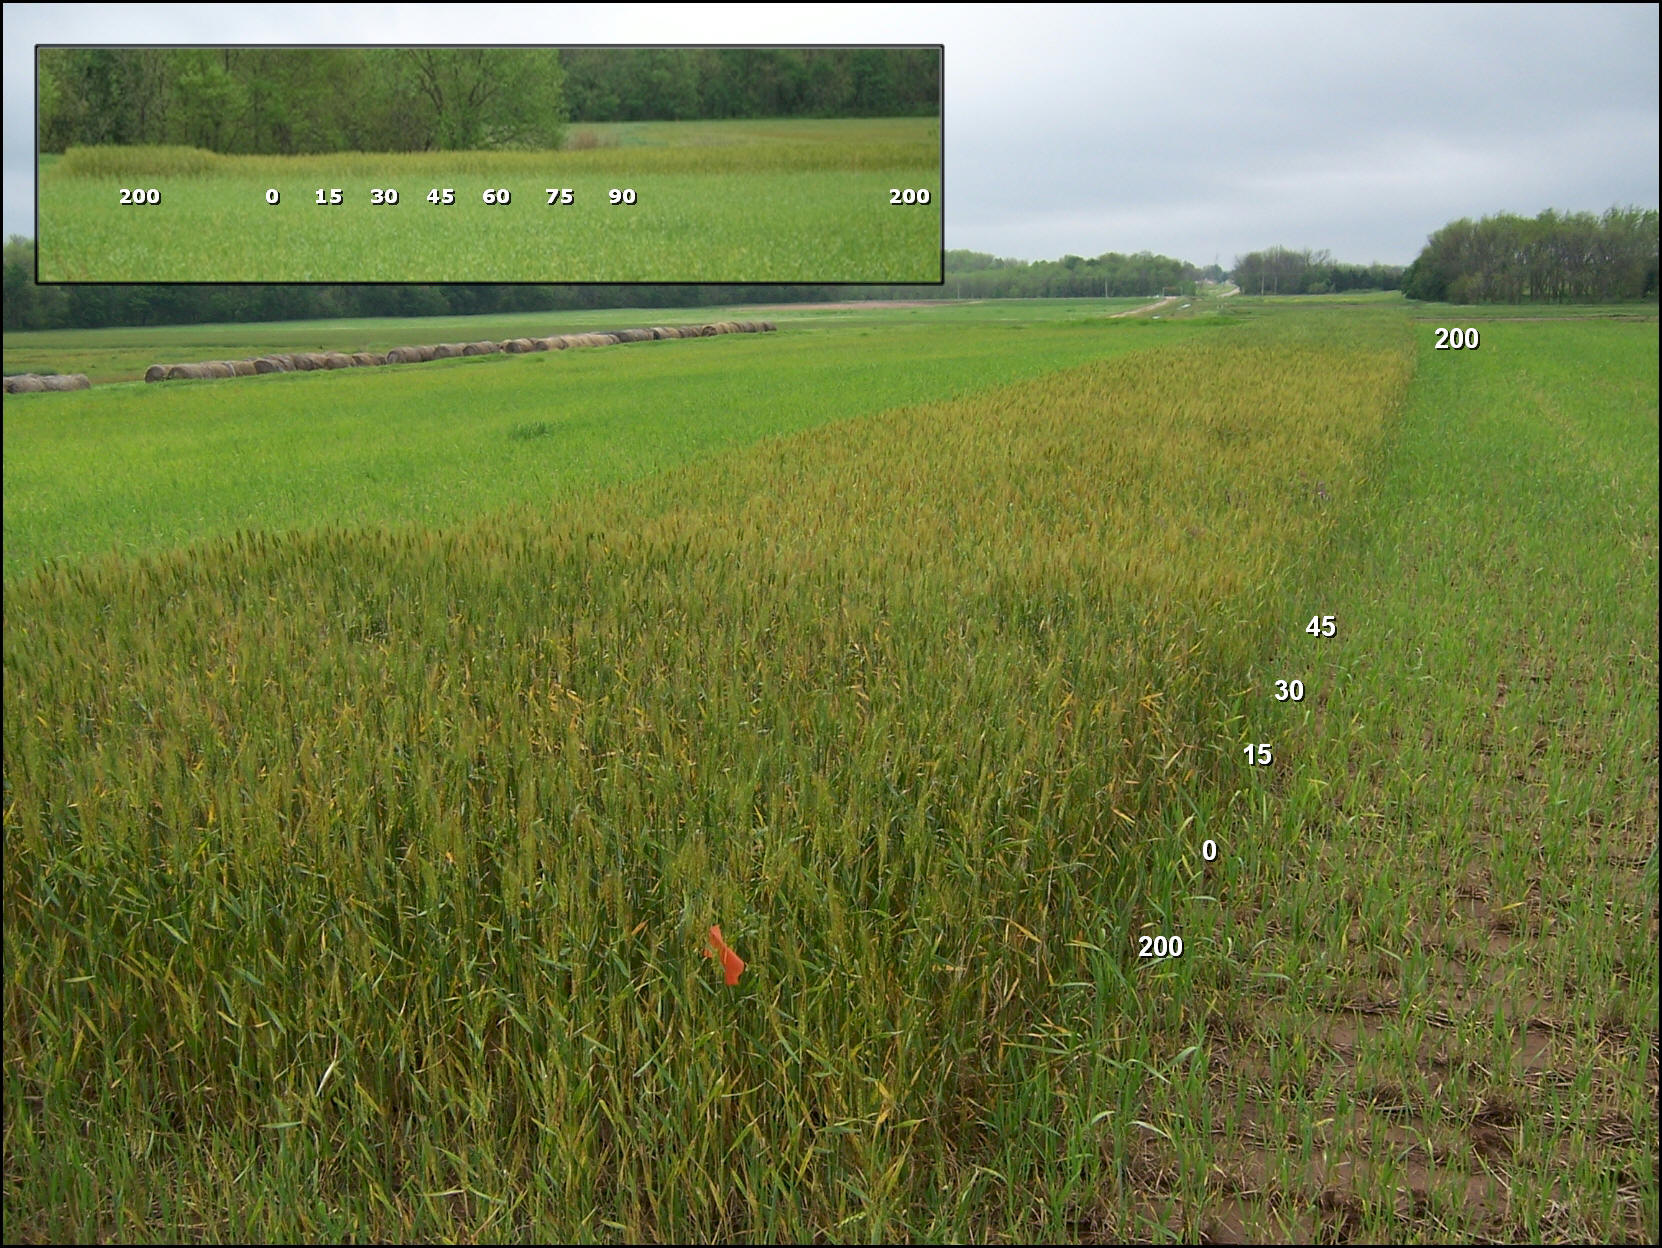
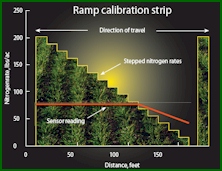
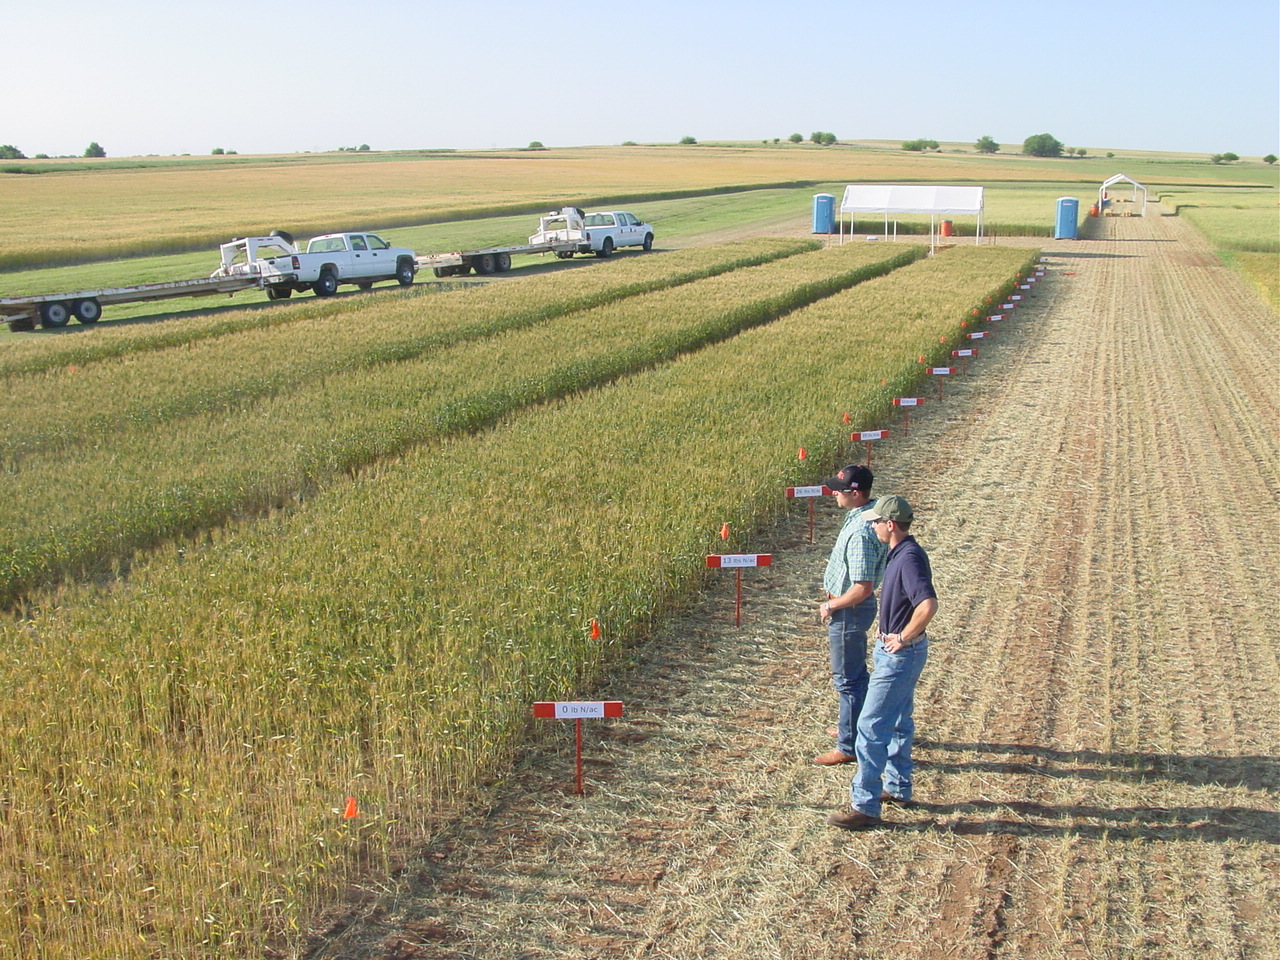
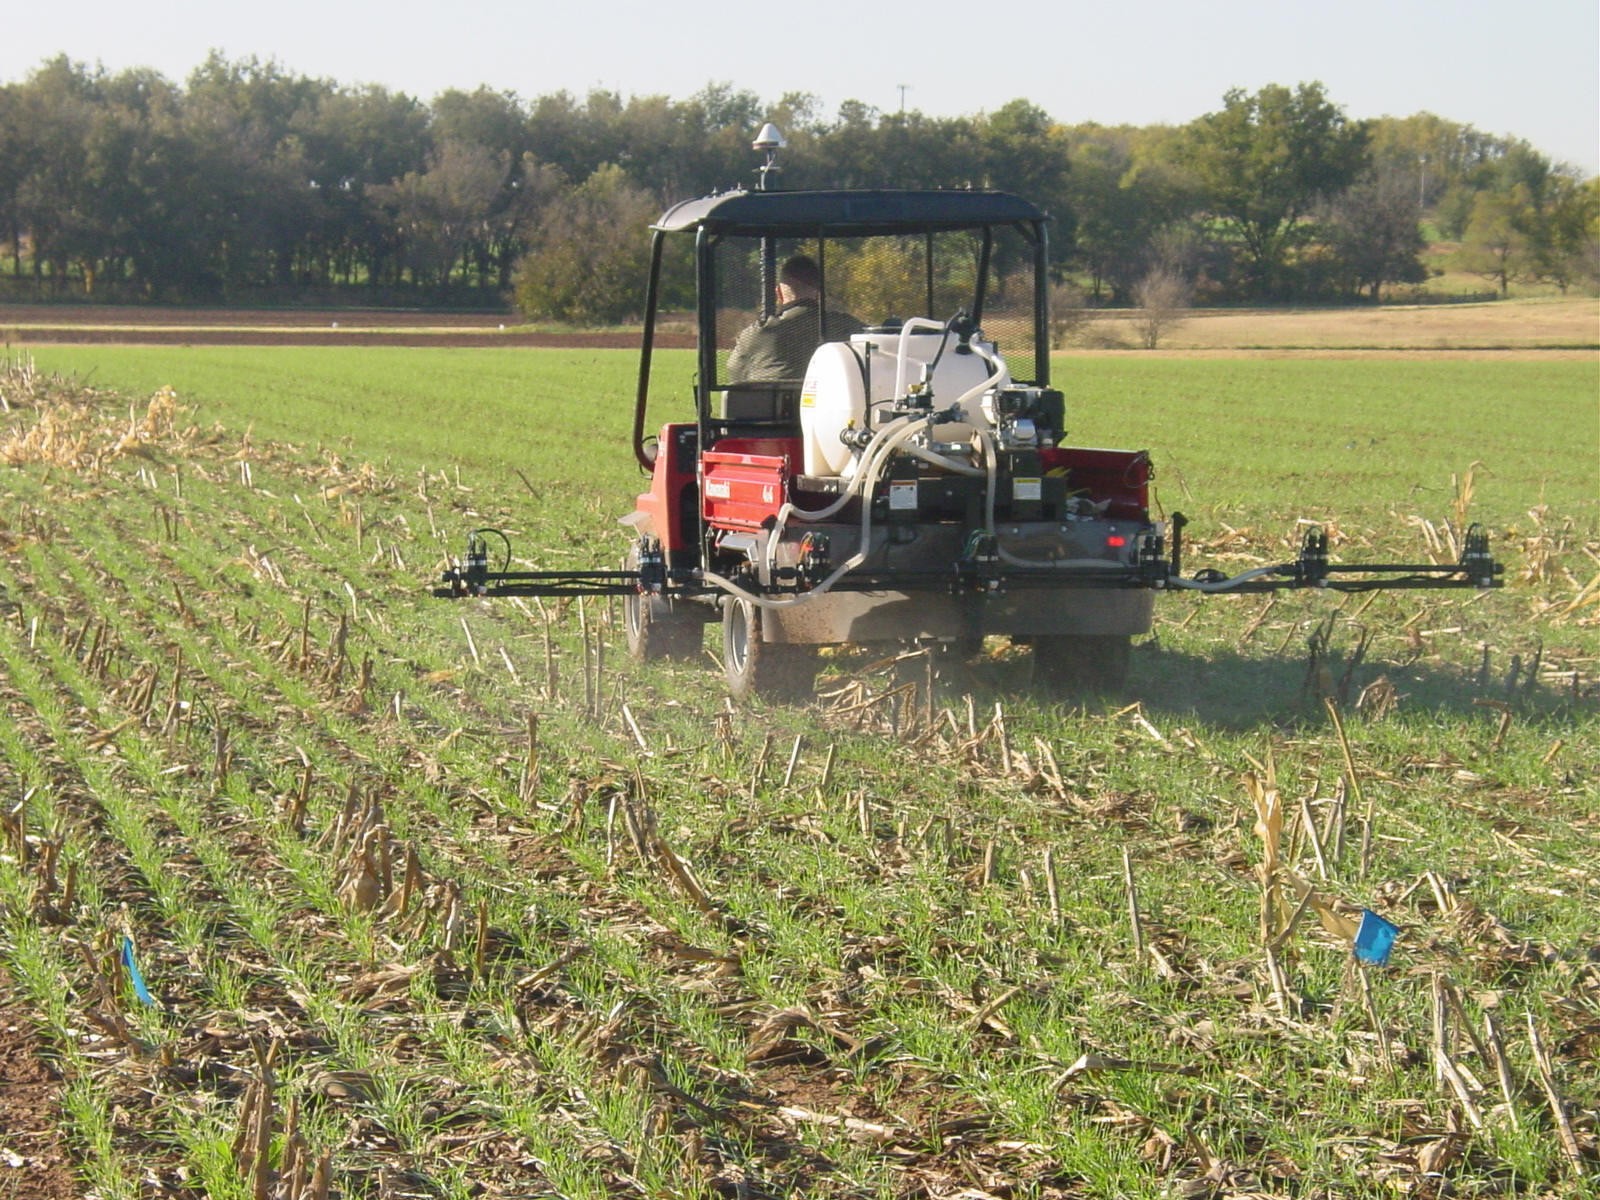
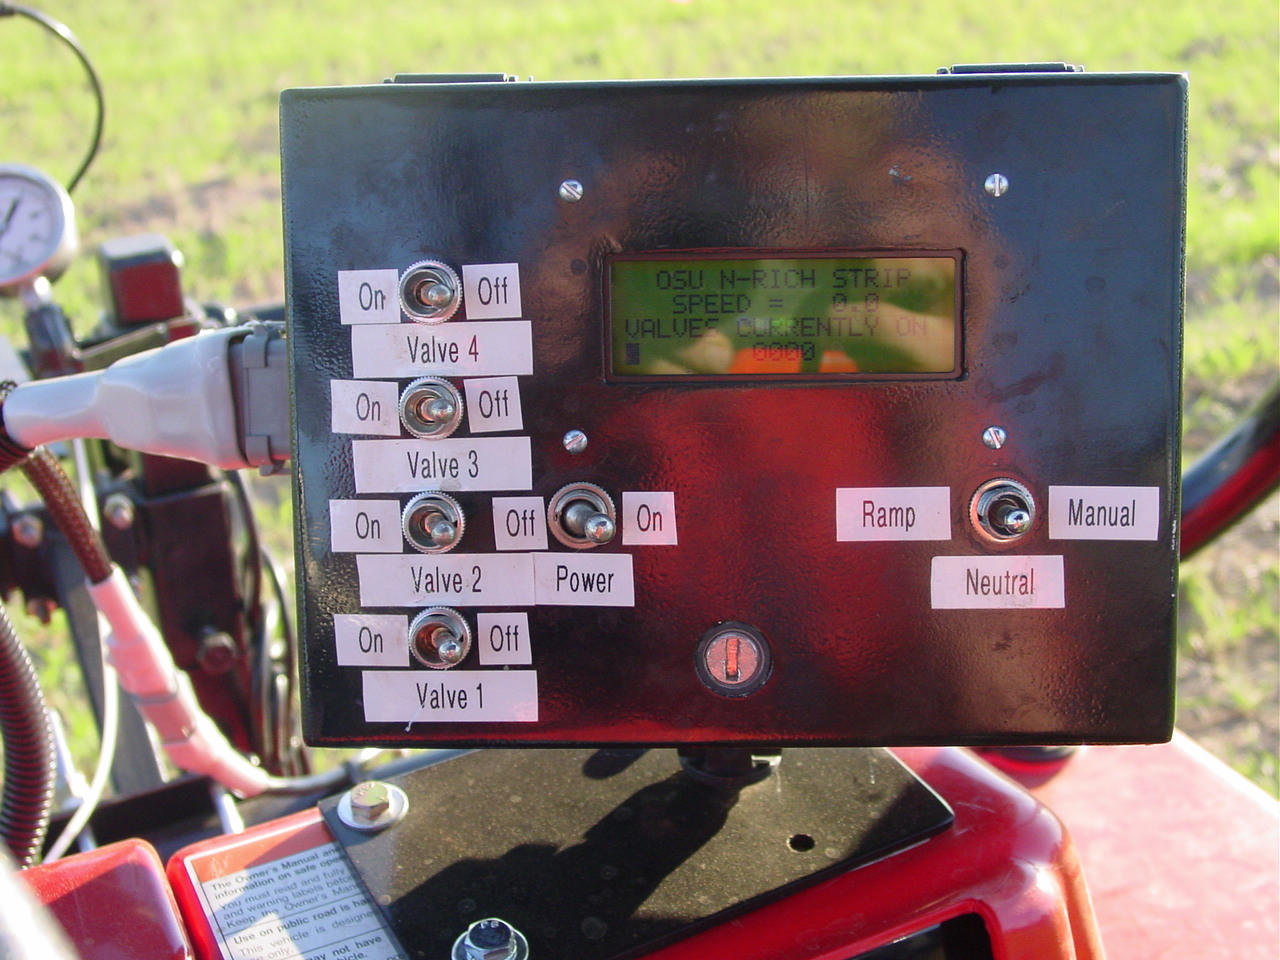
The new Ramped Calibration Strip Applicator applies increasing levels of N in a strip across a fixed distance (160 to 320) feet. The levels applied range from 0 at the start of the strip to the maximum that could ever be expected to be used. This fertilizer is applied pre-plant or in a very early crop growth stage. An N-rate recommendation can be determined by visual inspection or with a hand-held sensor by walking the strip from the low rate toward the high rate and stopping at the point where there are no further changes in crop growth or NDVI. The N-rate applied at that spot (where no further changes in NDVI were noted) is the N-rate recommendation.
6504 South 600 Road
Miami, OK 74354
R.Rt 1, Box 82
Helena, OK 73741
Randy Taylor
Department of Biosystems and Agricultural Engineering
Oklahoma State University
Stillwater, OK 74078
405 744 5277
randy.taylor@okstate.edu
Western Equipment
4501 E. Main, P.O. Box 391
Weatherford, OK 73096
580 772-5578
580-331-7107
N Rich Strip Adopters
Steinert’s near Hennessey
Brent Rendel (see link below where he has developed
several rampers)
Jimmy Wayne Kinder, near Walters
Panhandle via extension presentations Brian gave in
Boise City and Woodward
Jason Lawles via Western Equipment (several hundred)
Levi and Curtis Johnson Brothers (developed the J2 ramper, , see below,
Helena, OK)
Joe Biggerstaff, Engineering Student of Solie’s (every field they owned and
rented)
Curtis Fischer (Kingfisher)
Kim Metcalf (now with Estes Chemical)
Gerald Wynes (Ponca City), many
Jagadeesh Mosali (N rich strips in Bermuda, many locations)
Roger Gribble (many)
Ivan Peck (many on his own for the last 5 years)
Monsanto (many via Kyle Freeman, Kyle Lawles, and Paul Hodgen)
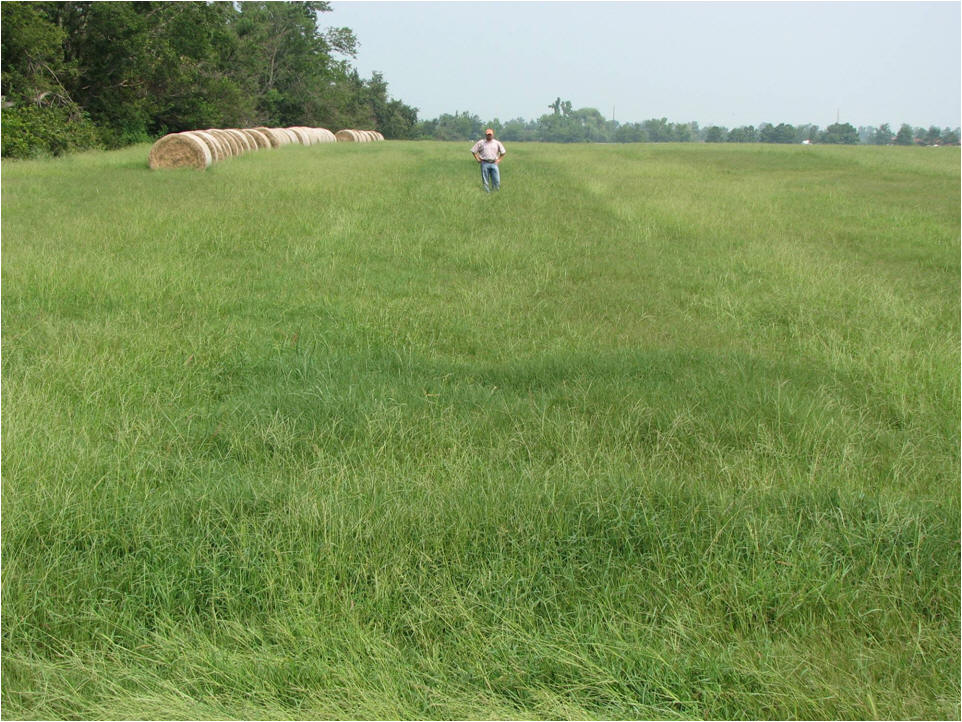
Delaware County, Bermudagrass, 2007 (RAMP peaked at 200 lb N/ac, with a range from 0 to 350 lb N/ac.
 Some
of our earlier approaches are included on this page, in addition to
equipment configurations delineated by our Agricultural Engineering Team
Some
of our earlier approaches are included on this page, in addition to
equipment configurations delineated by our Agricultural Engineering Team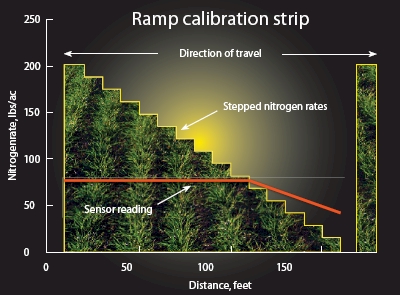
How precise is Precision Farming
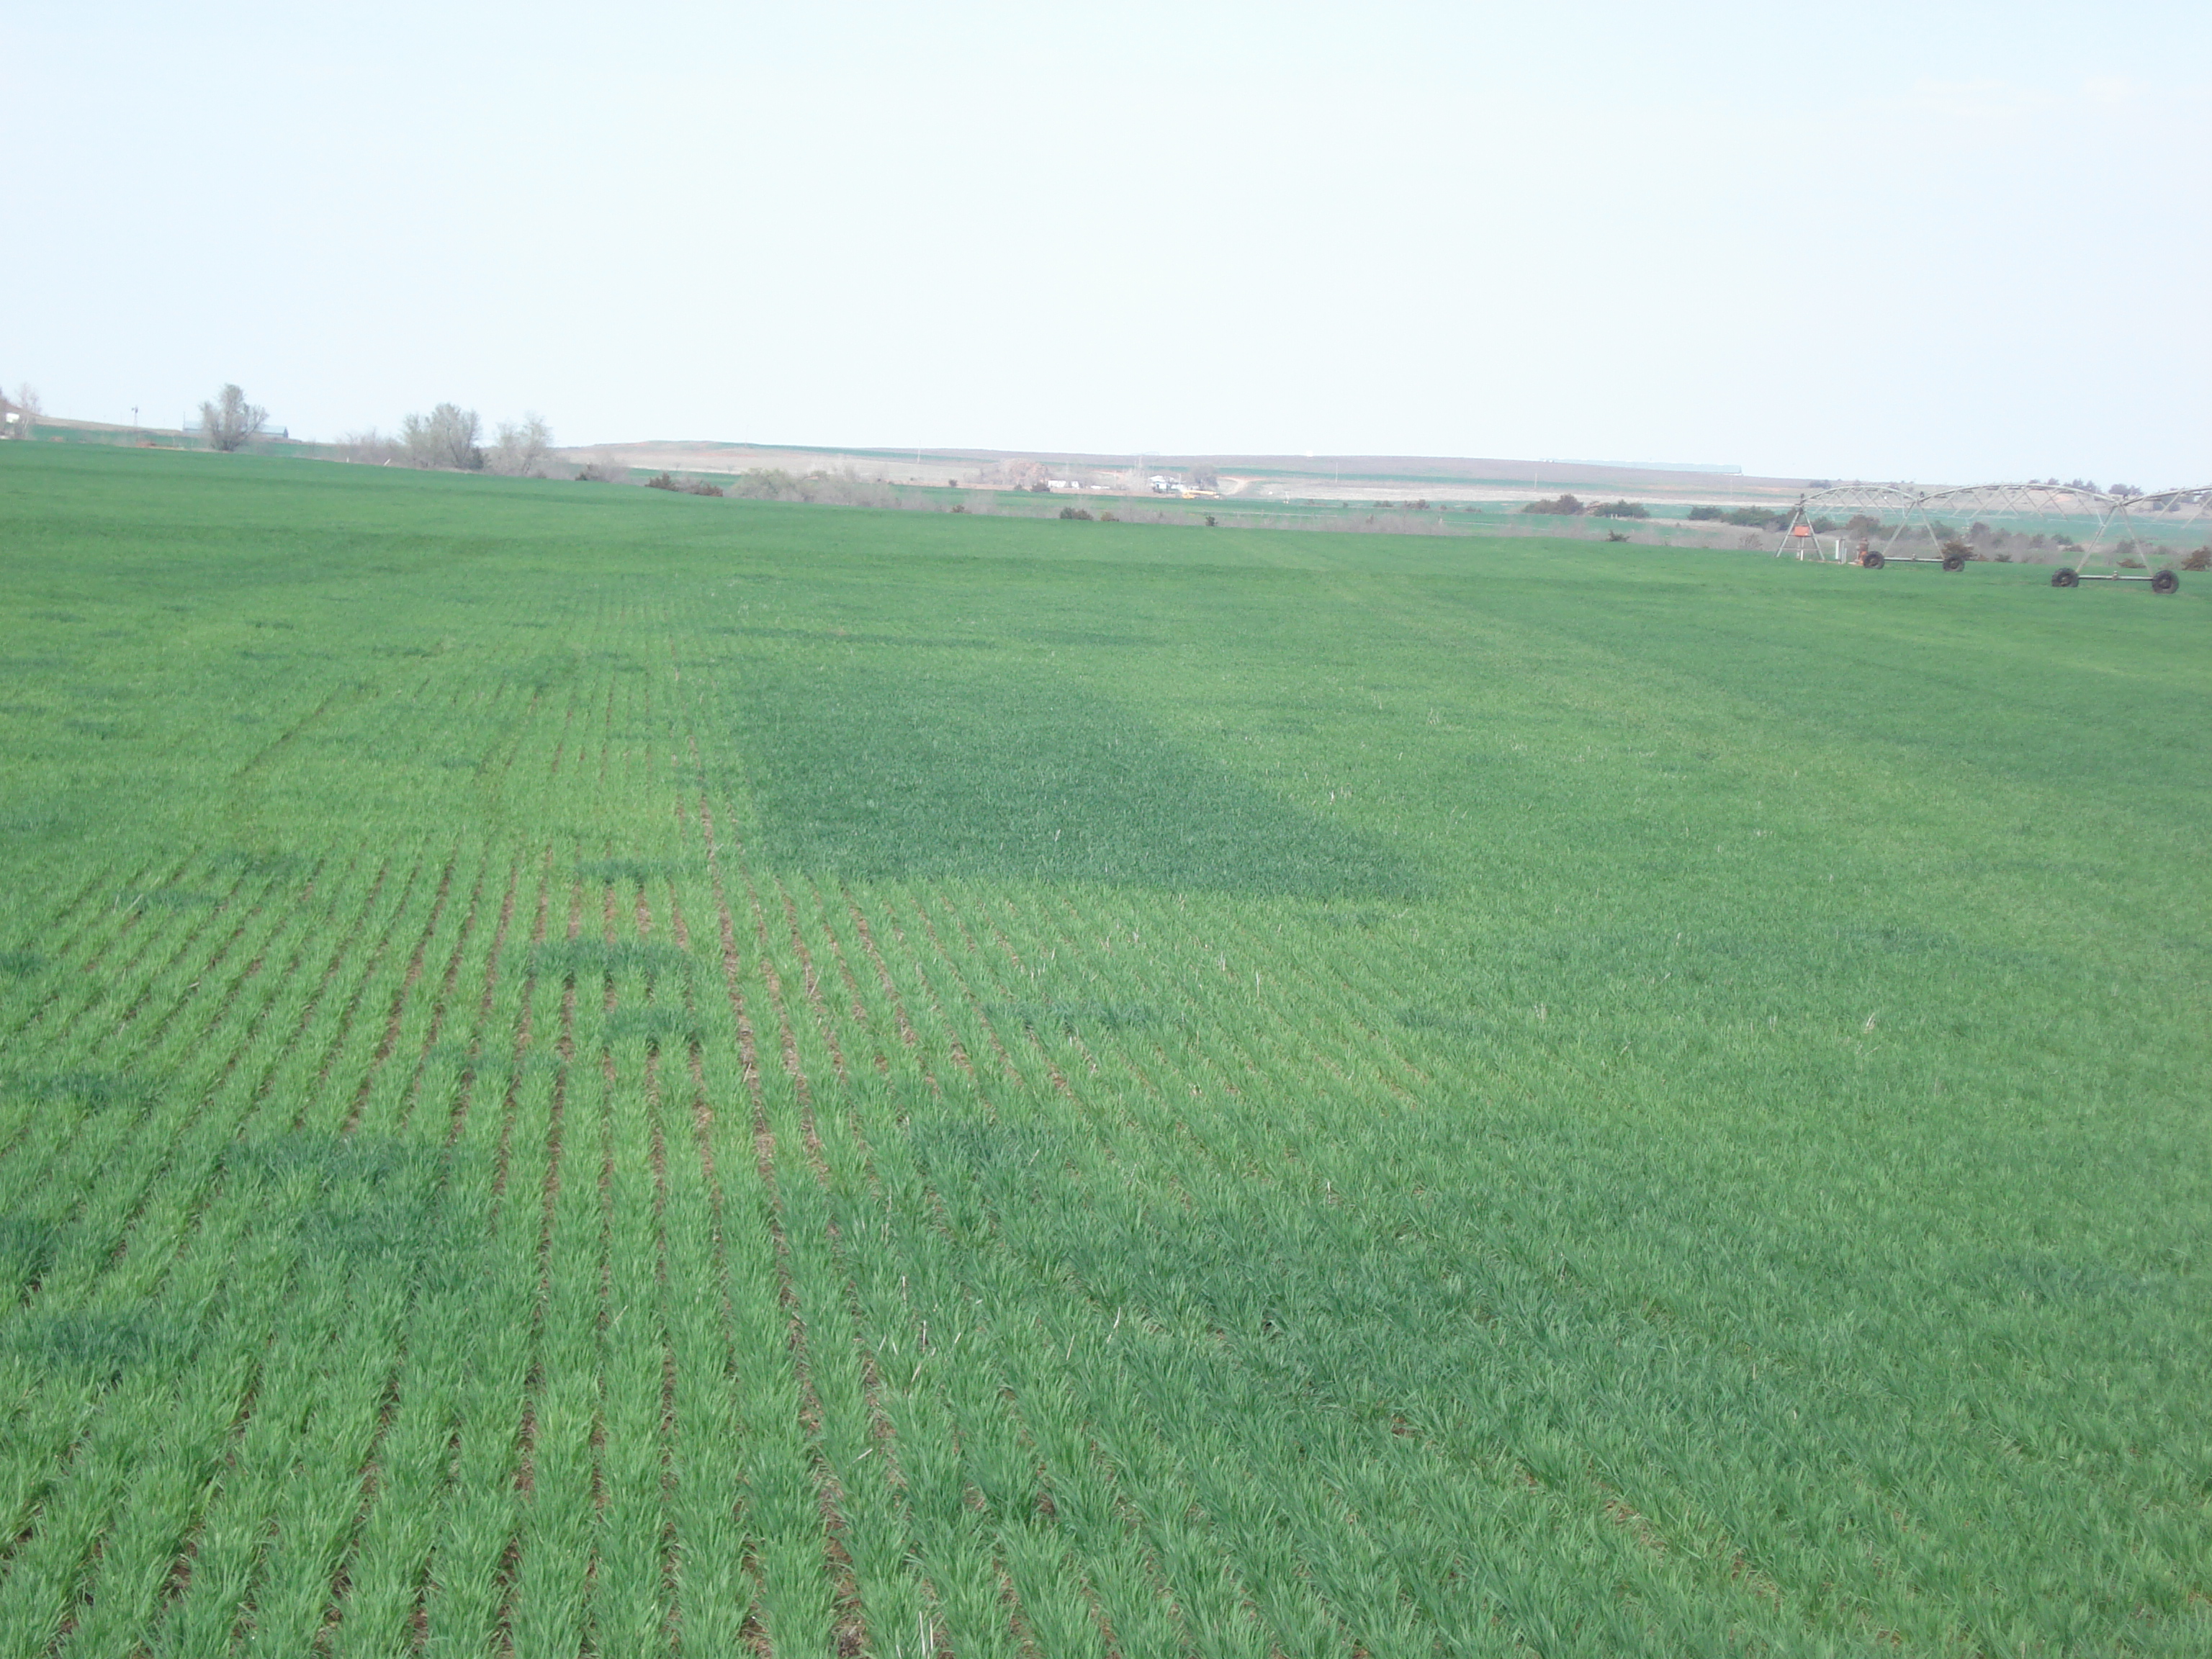
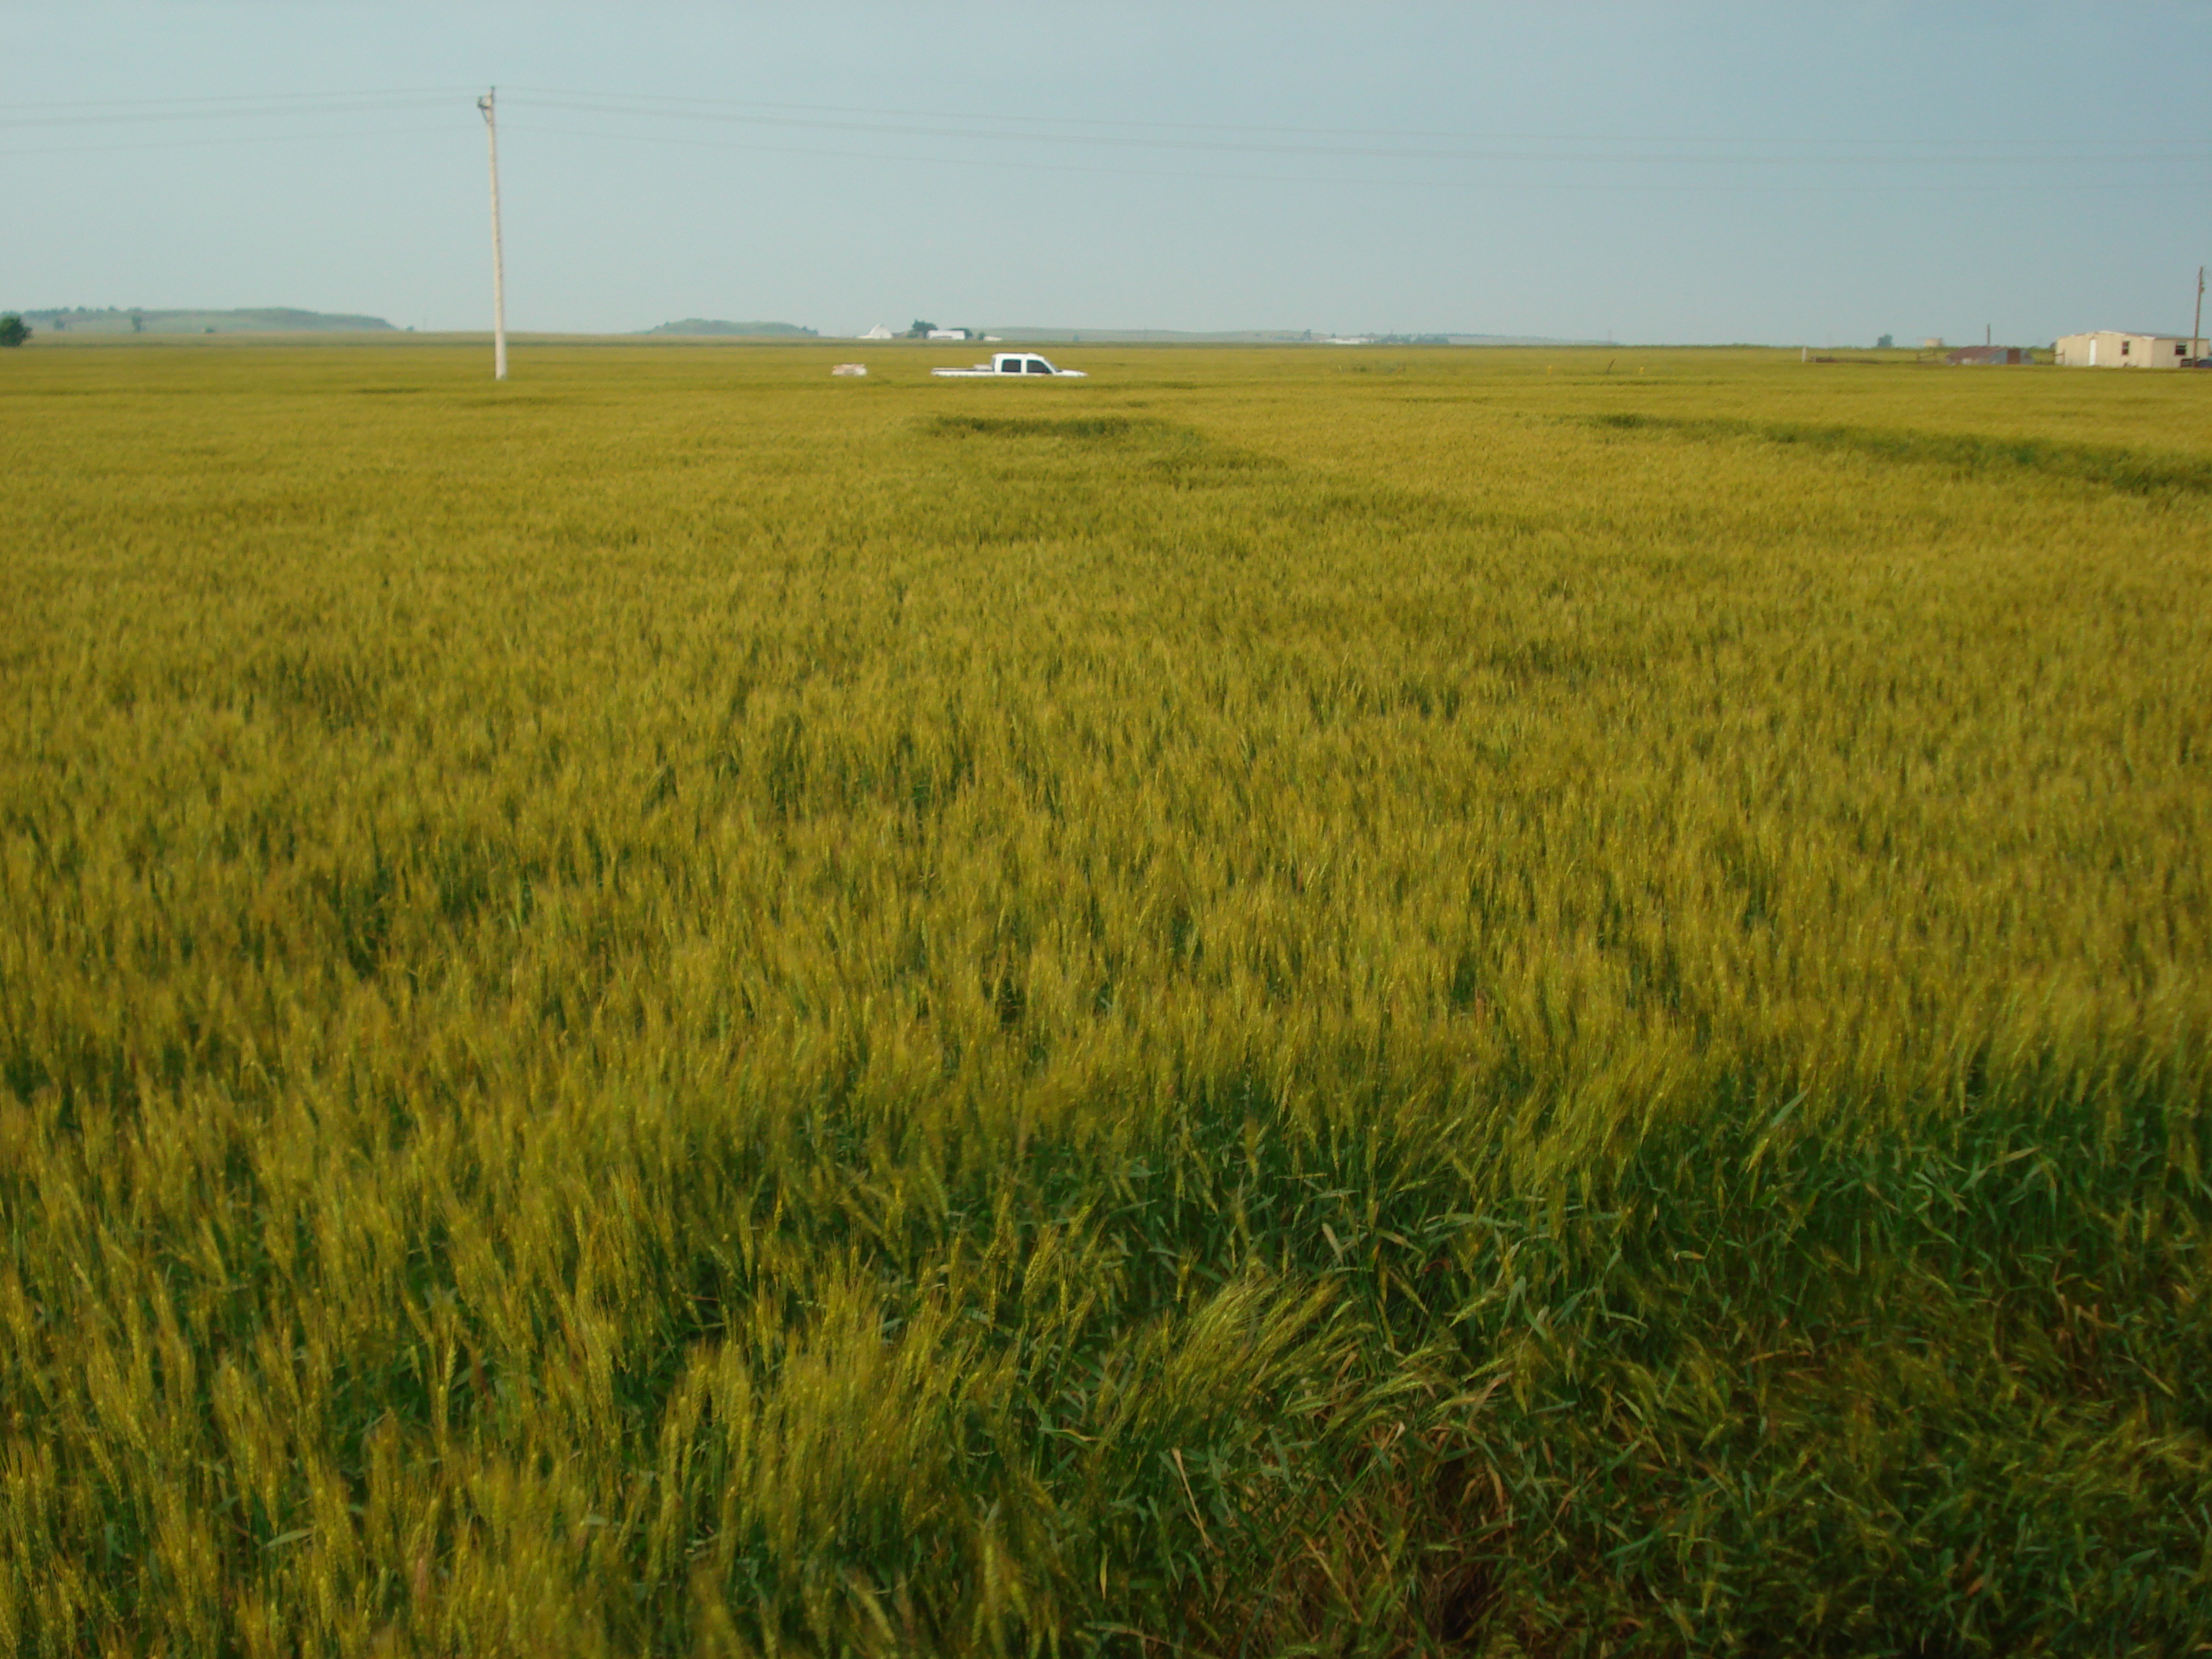
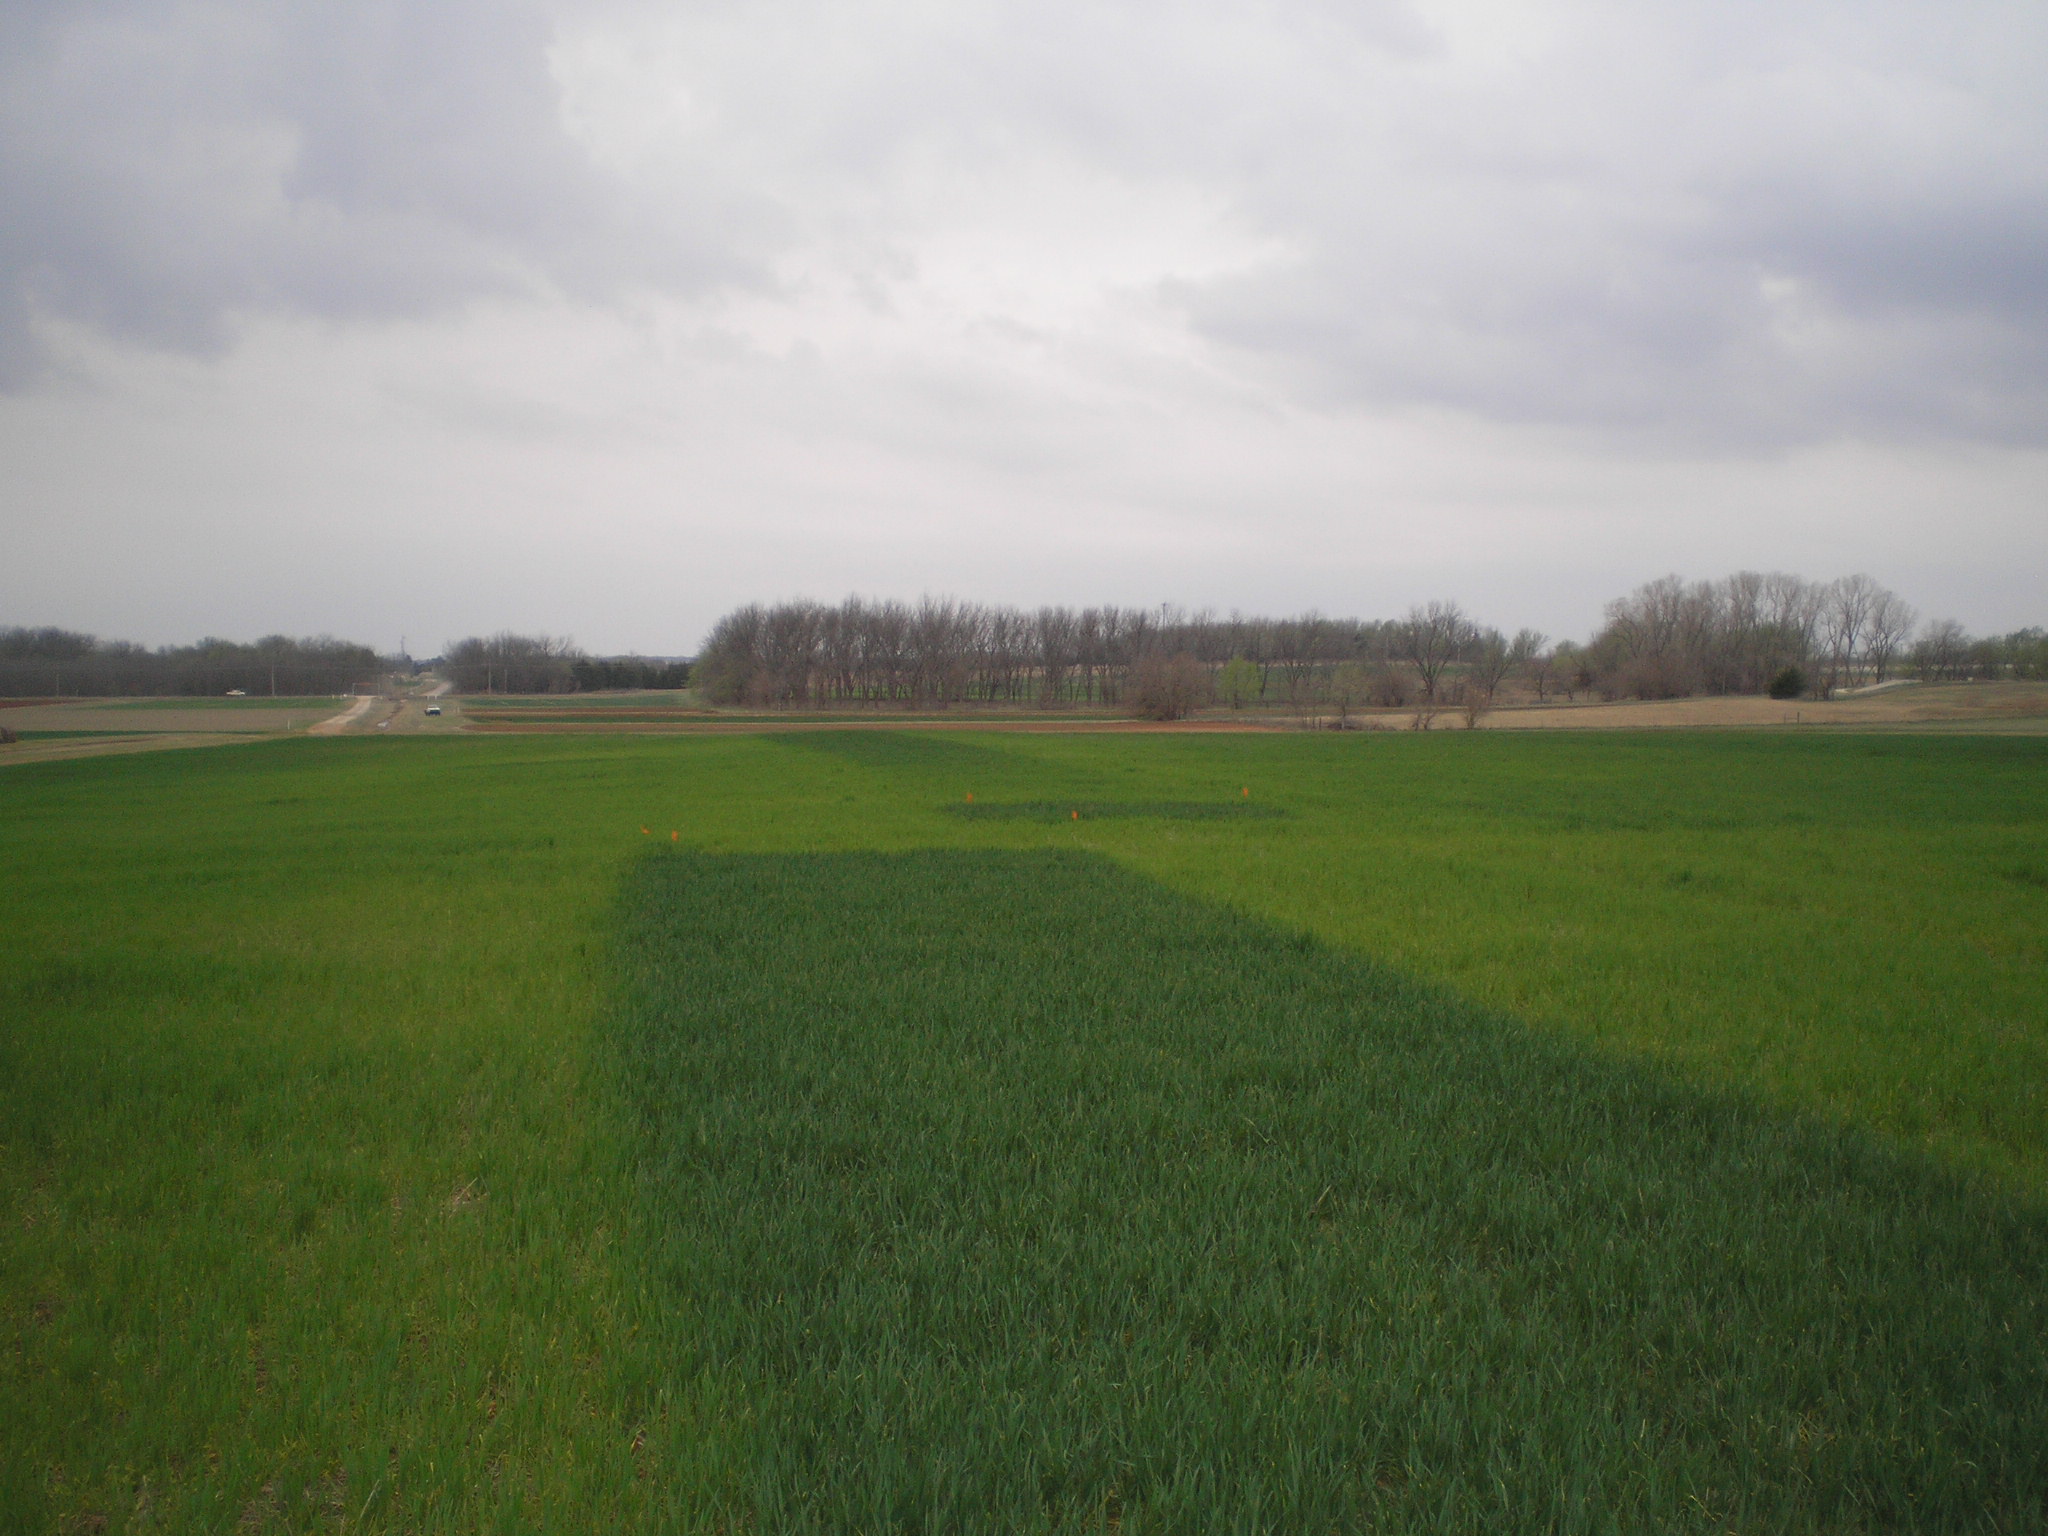
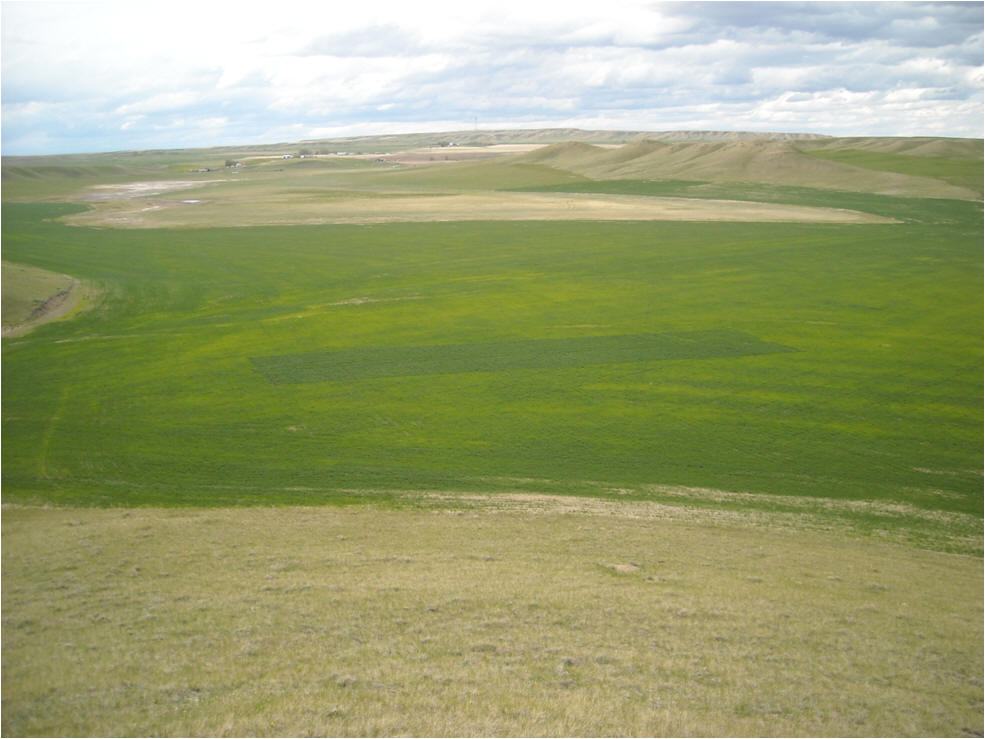
Visible spatial variability within the RAMP, western Oklahoma.
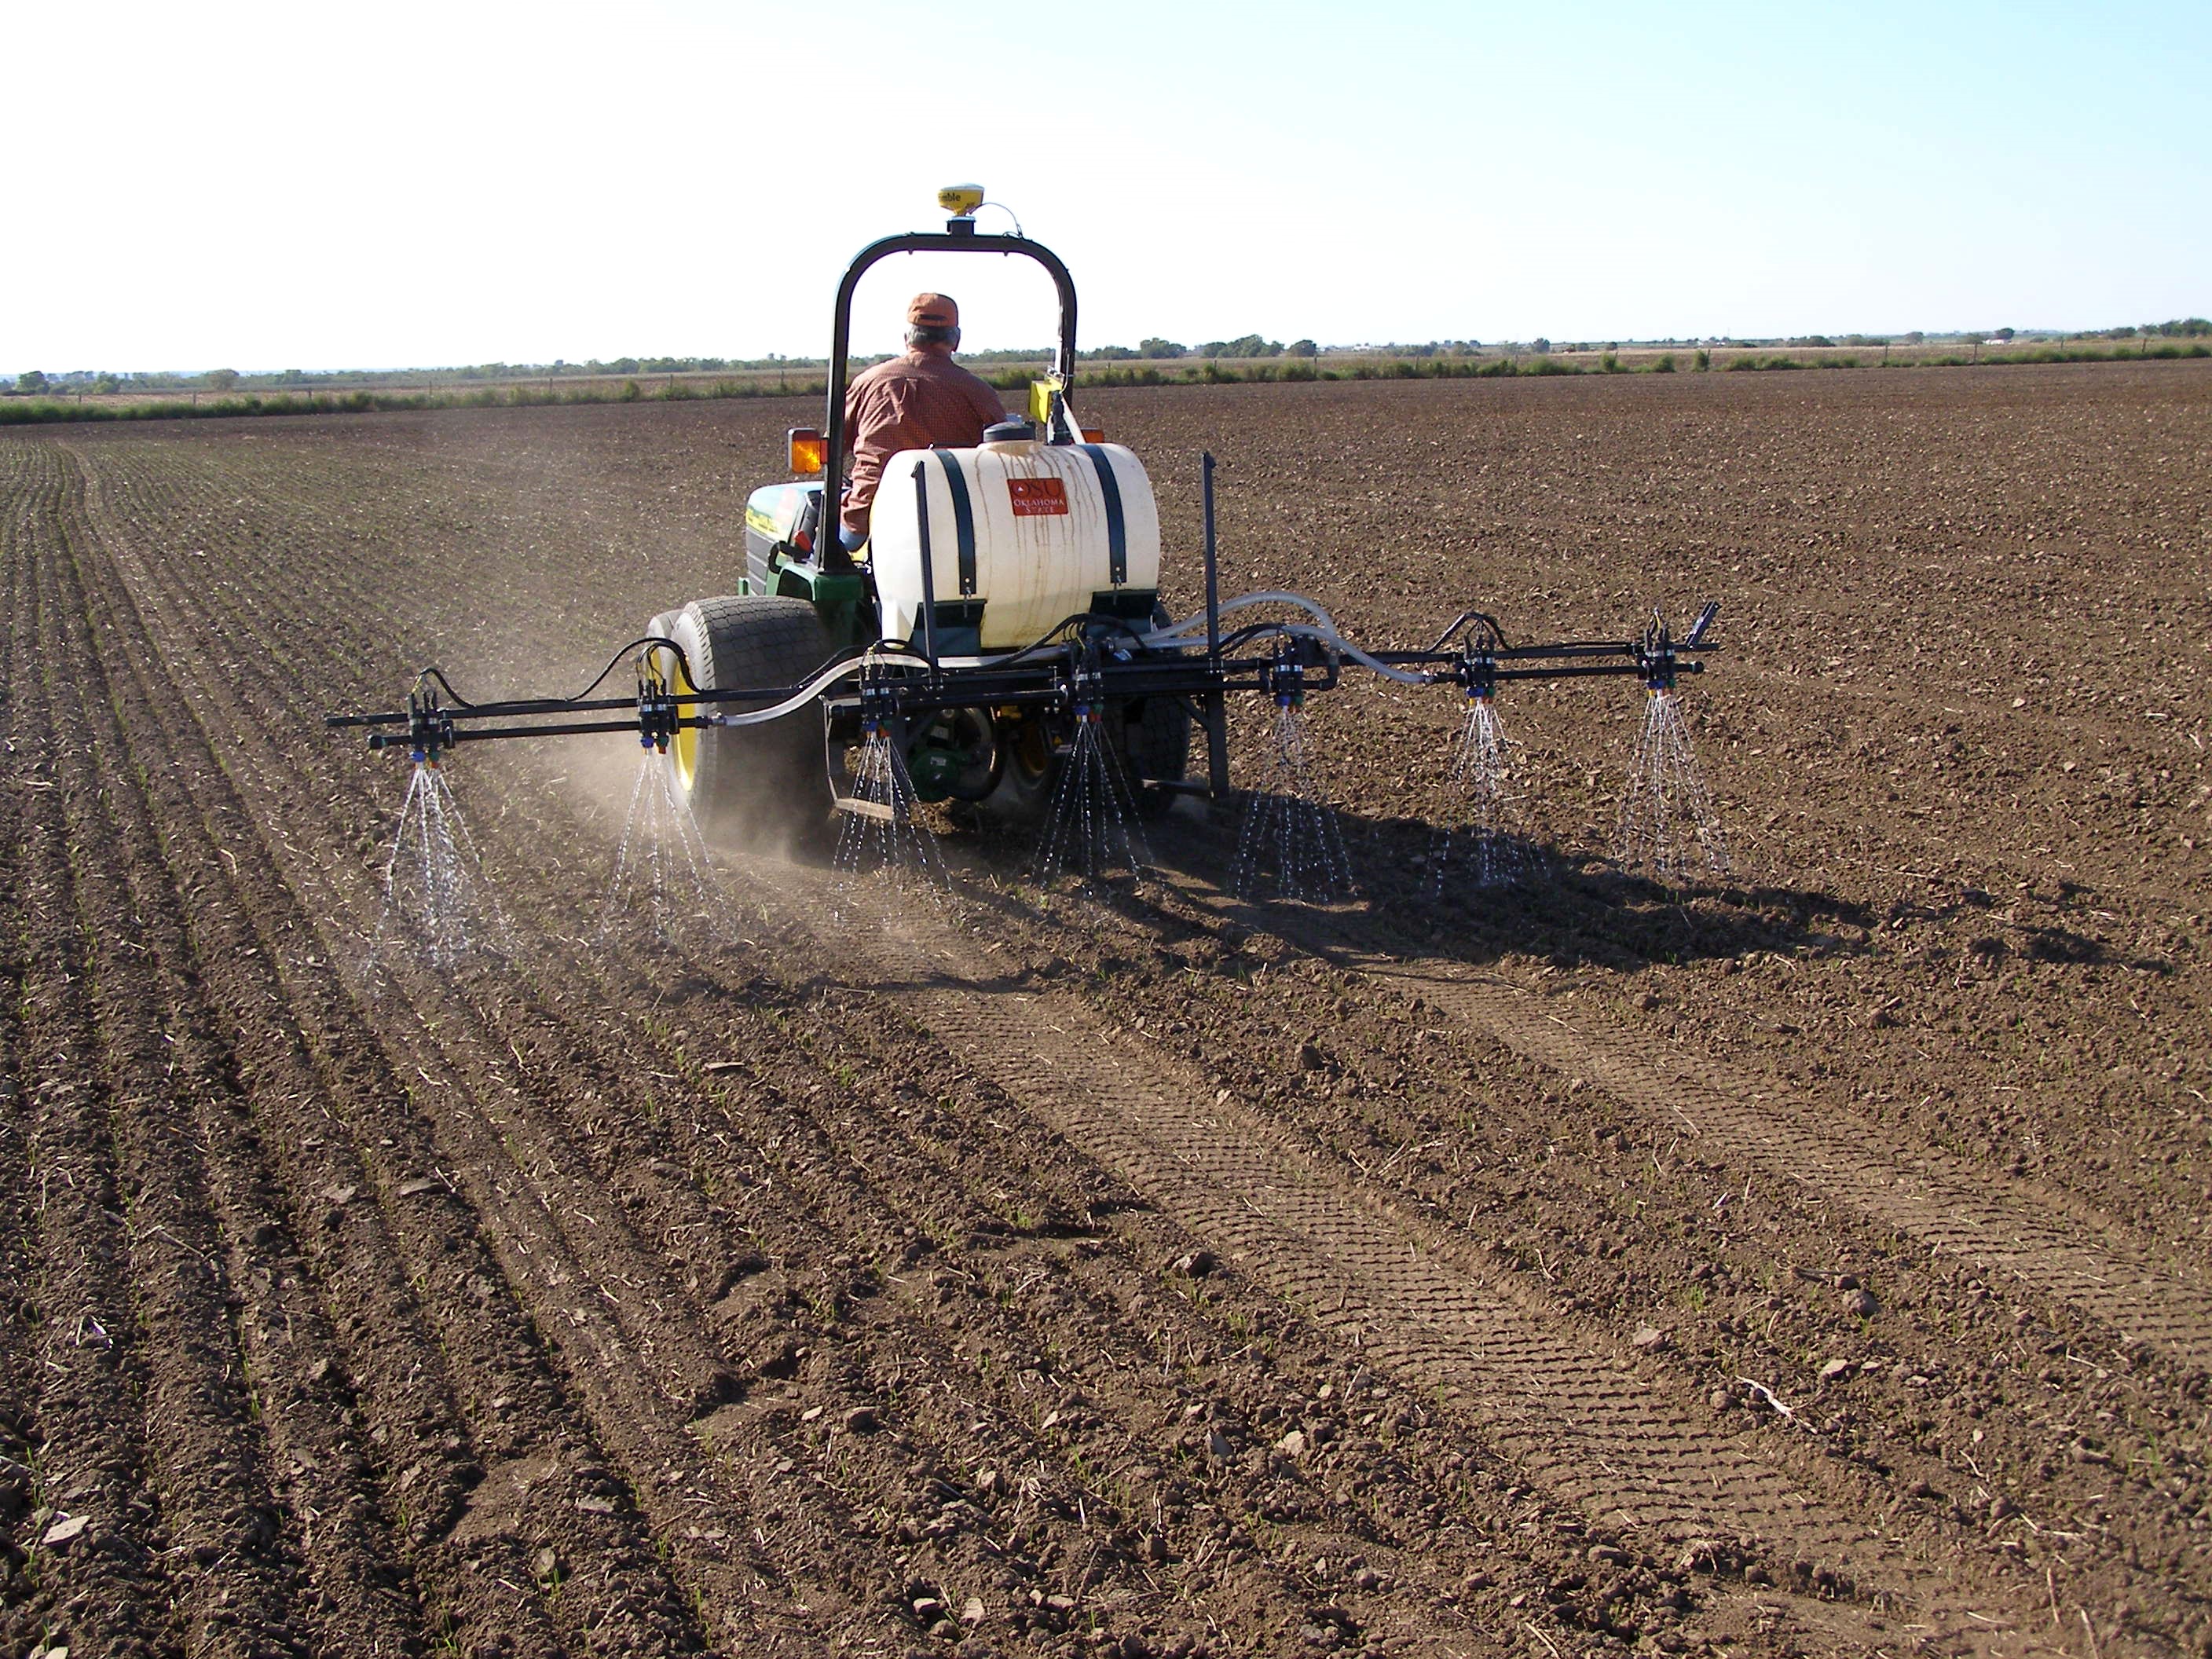
RAMP at Efaw, just west of Stillwater, March 22, 2007
Pictures above taken March 20, 2007 showing both RAMPS using the
configuration delineated in the figure below

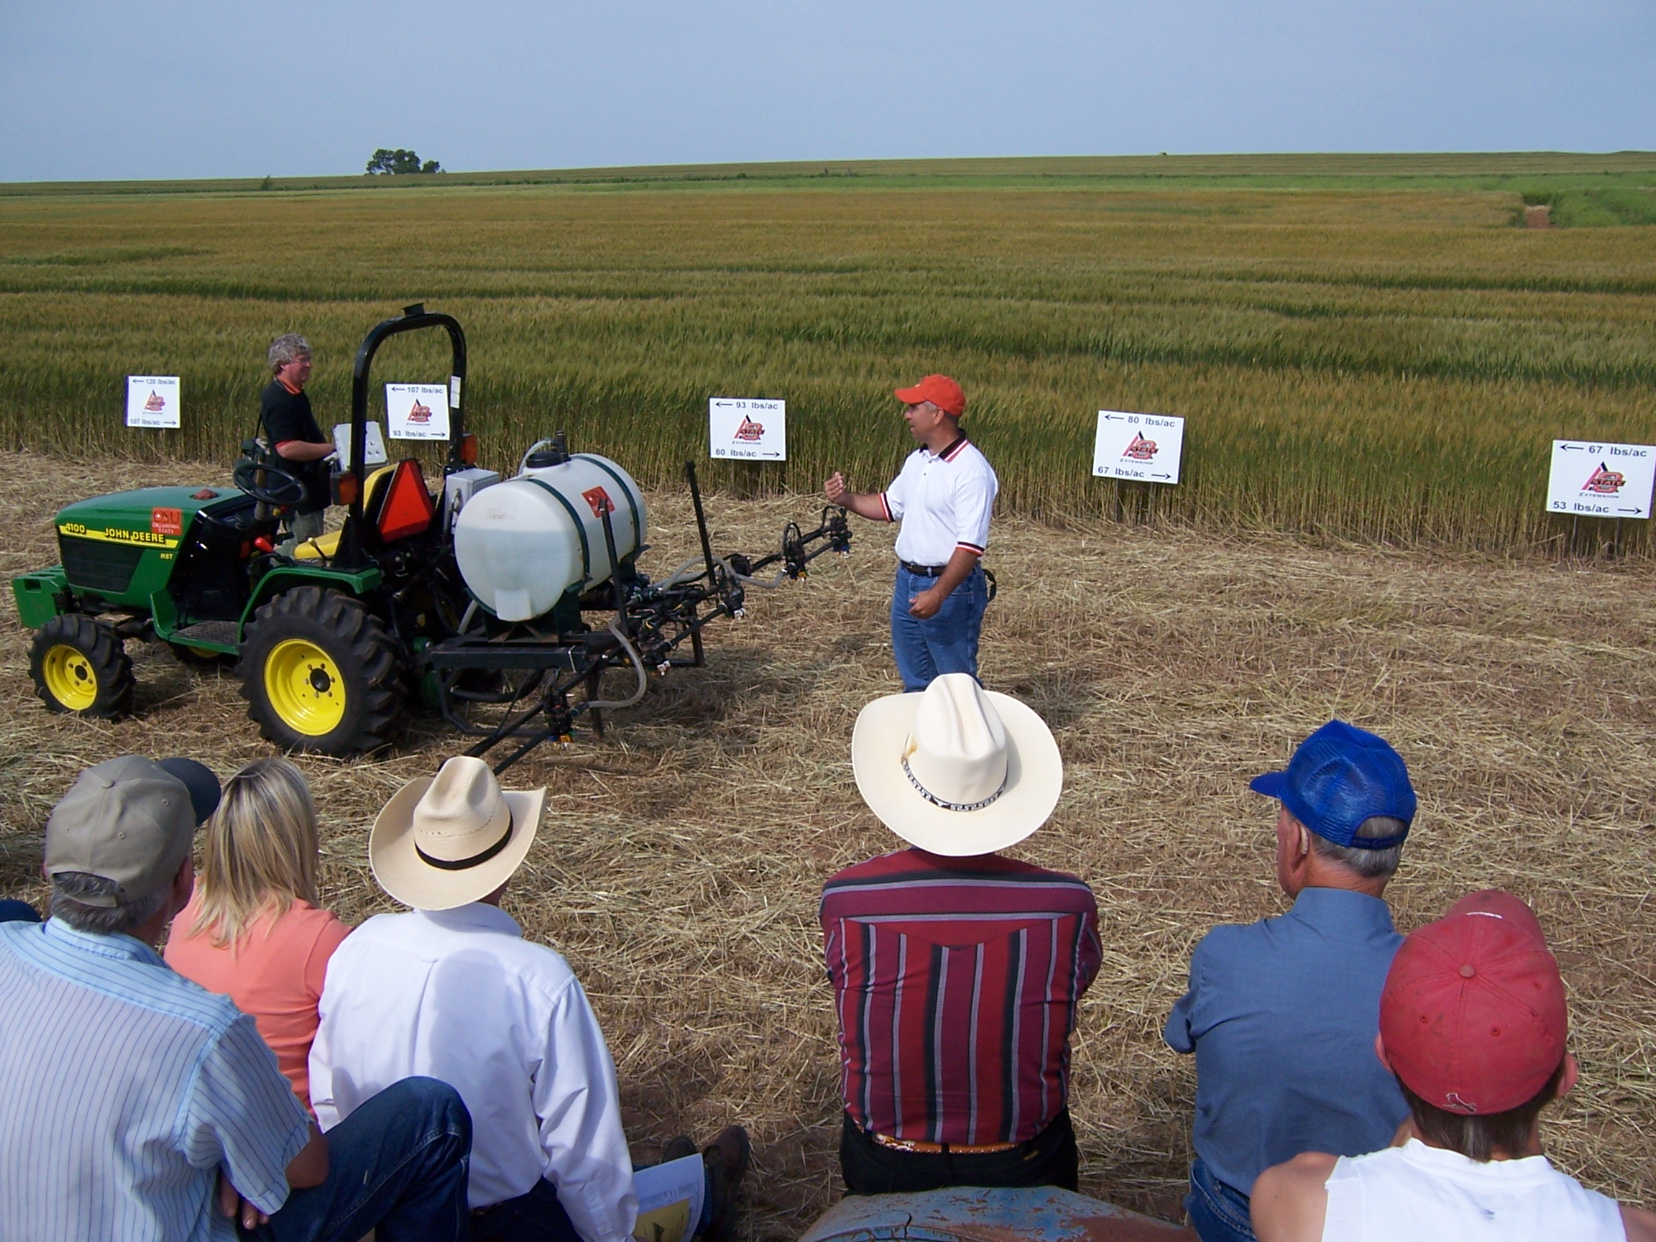
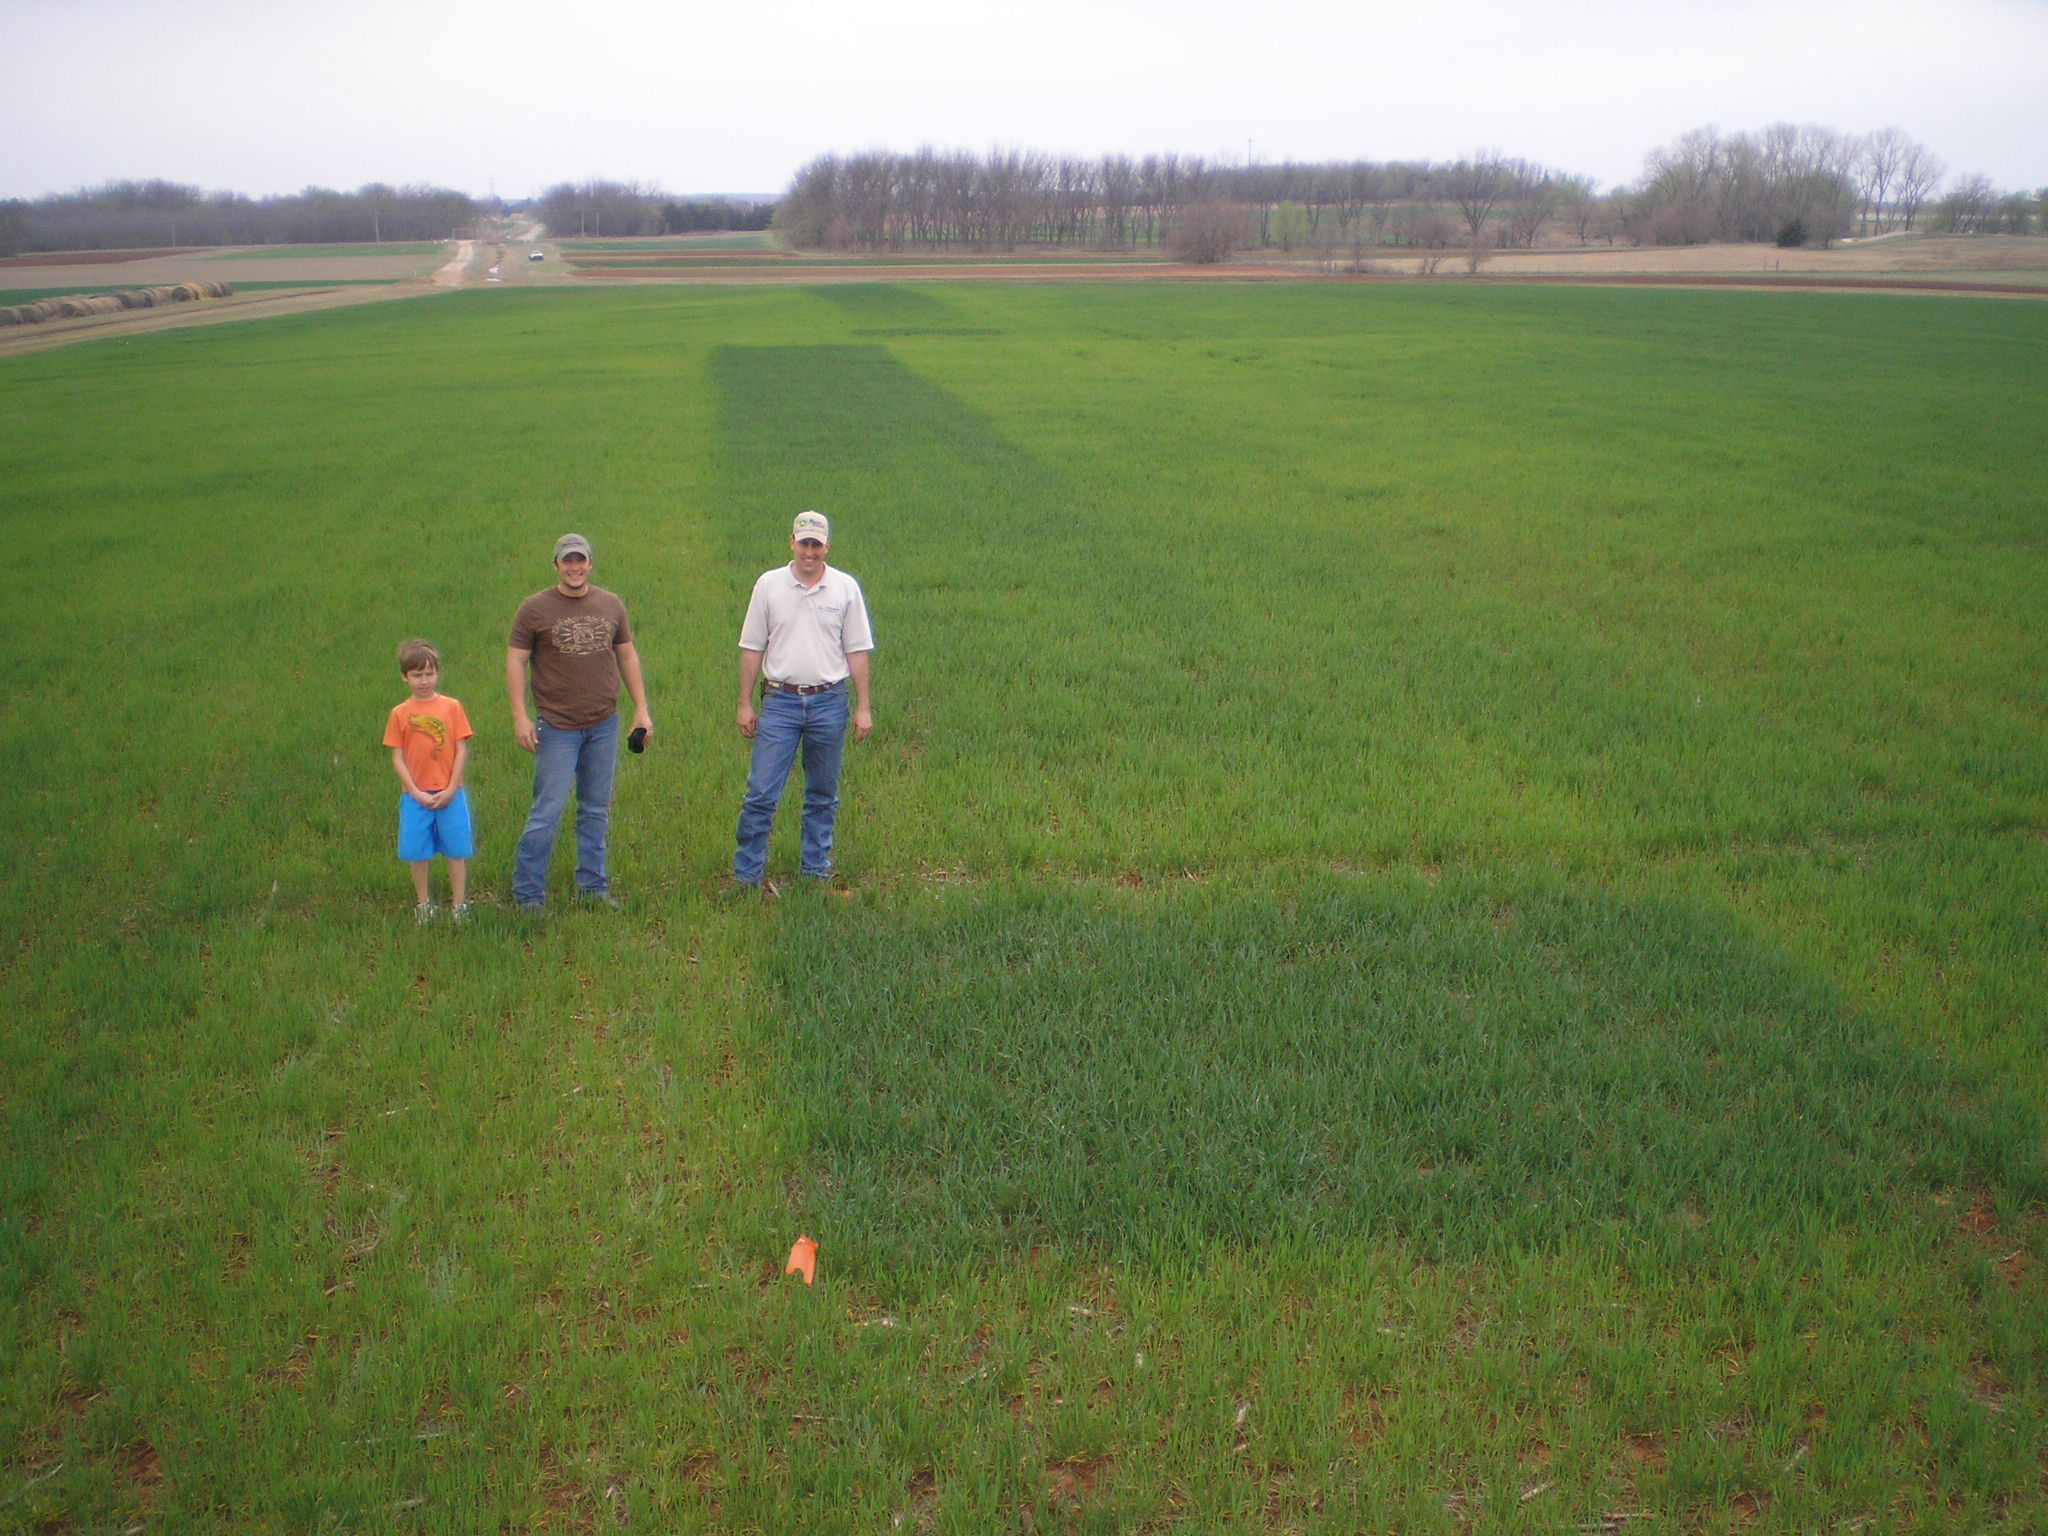
RAMP concept and results being demonstrated at a field day, May 18, 2007 in Lahoma to wheat and corn farmers by Dr. Randy Taylor
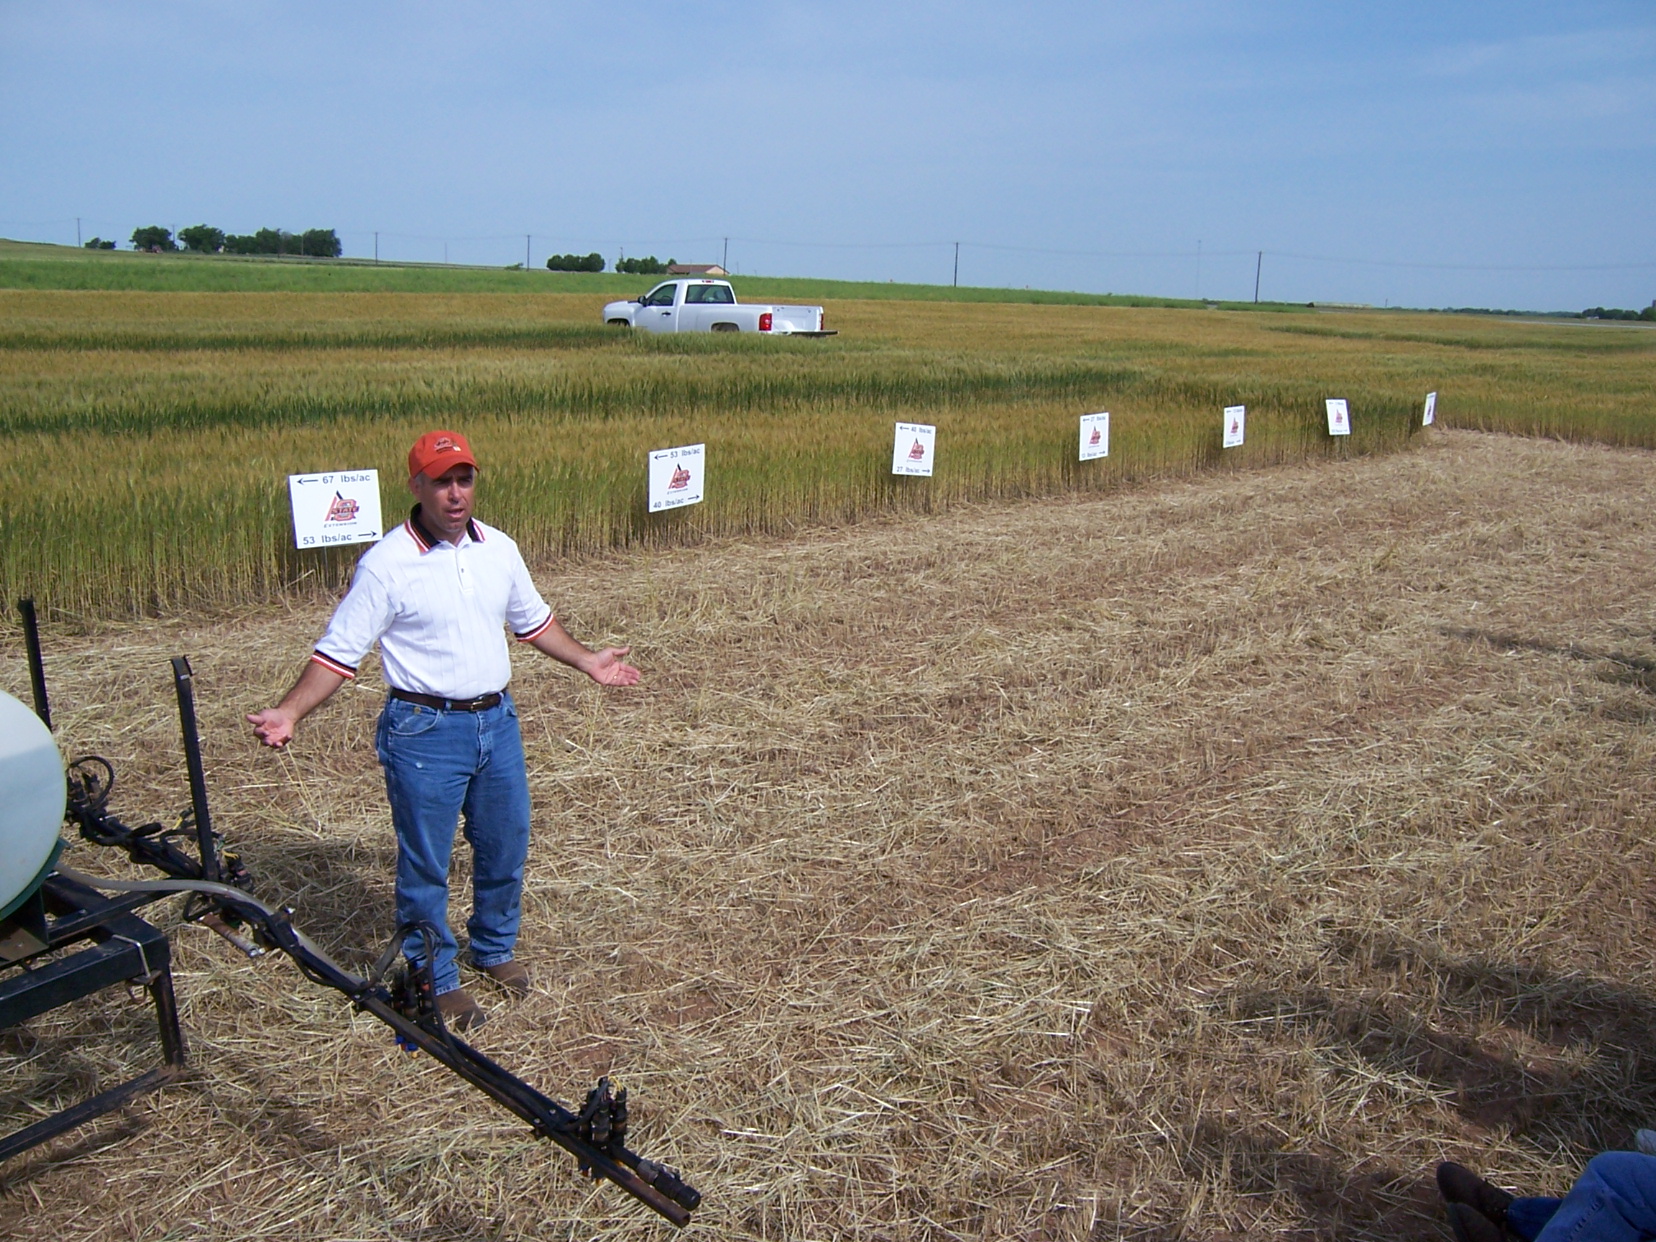
Dr. Randy Taylor asks producers, "Is it better than what you are doing today?" Many producers embraced this approach given the prices of fertilizer N, and the reality that most have not changed their fertilizer N practices in over 30 years.
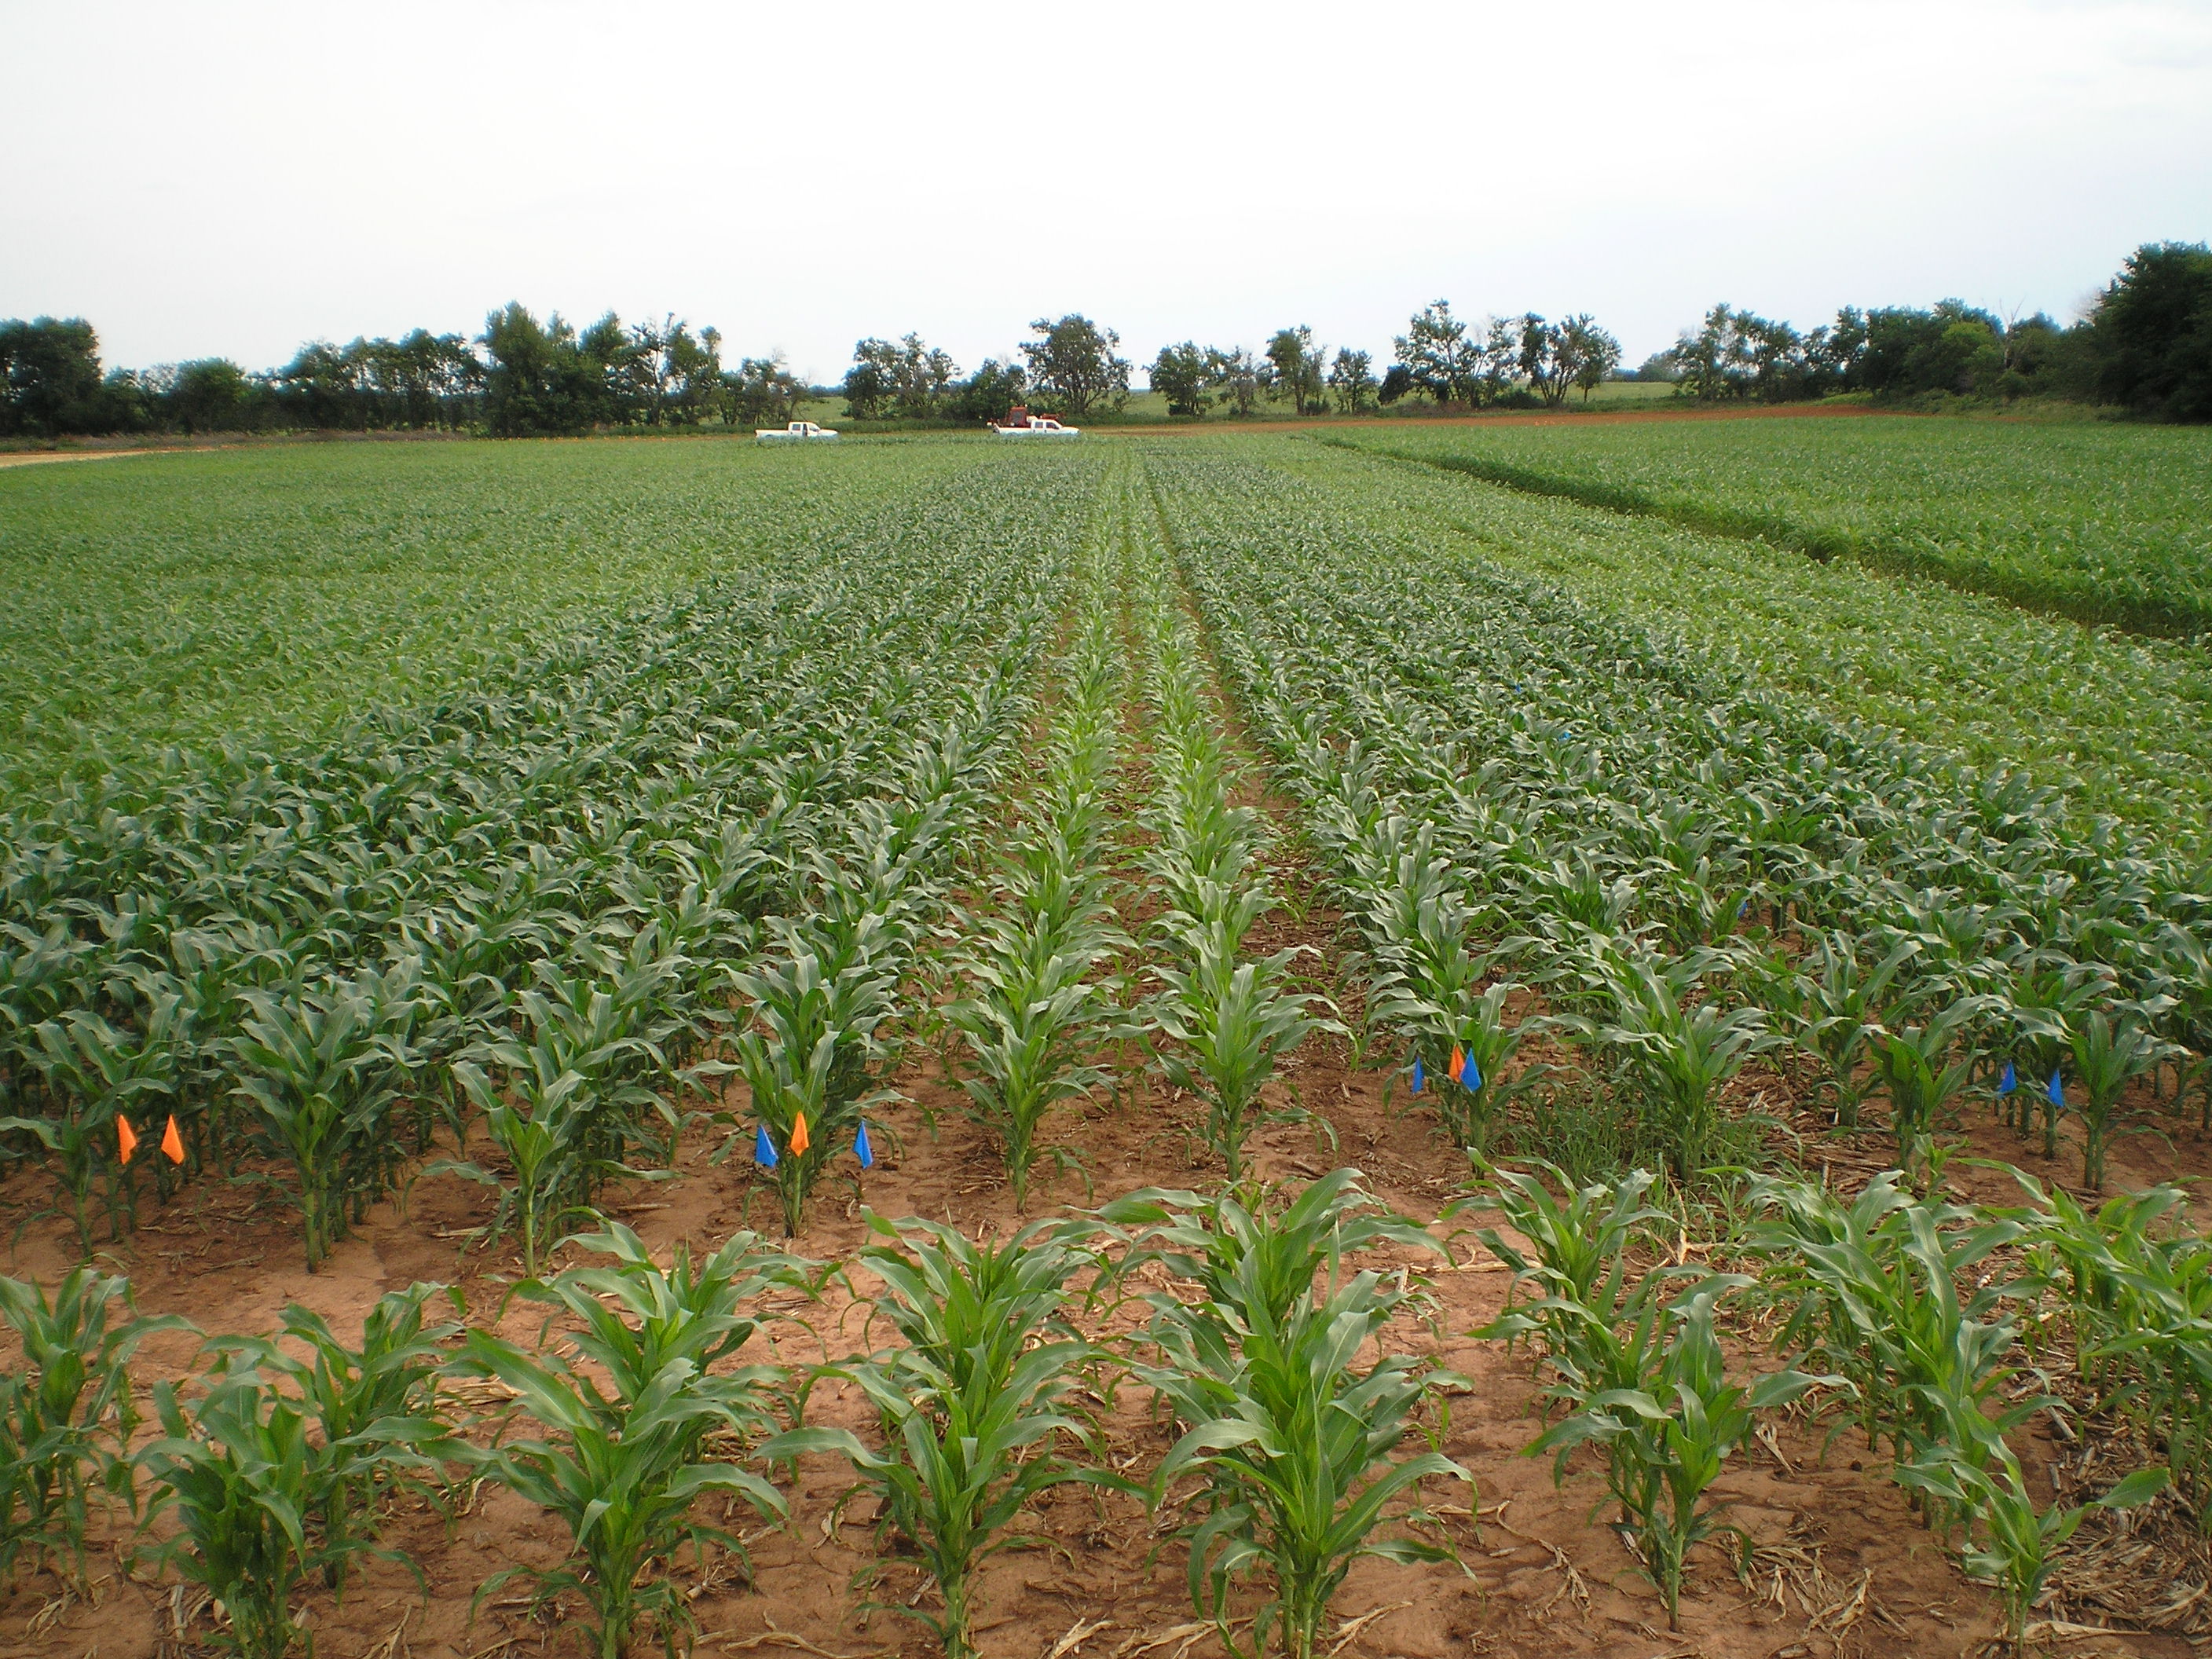
Ramp Calibration Strip applied in Corn, Lake Carl Blackwell, OK
How to obtain highly accurate mid-season fertilizer N rates using the Ramped Calibration Strip
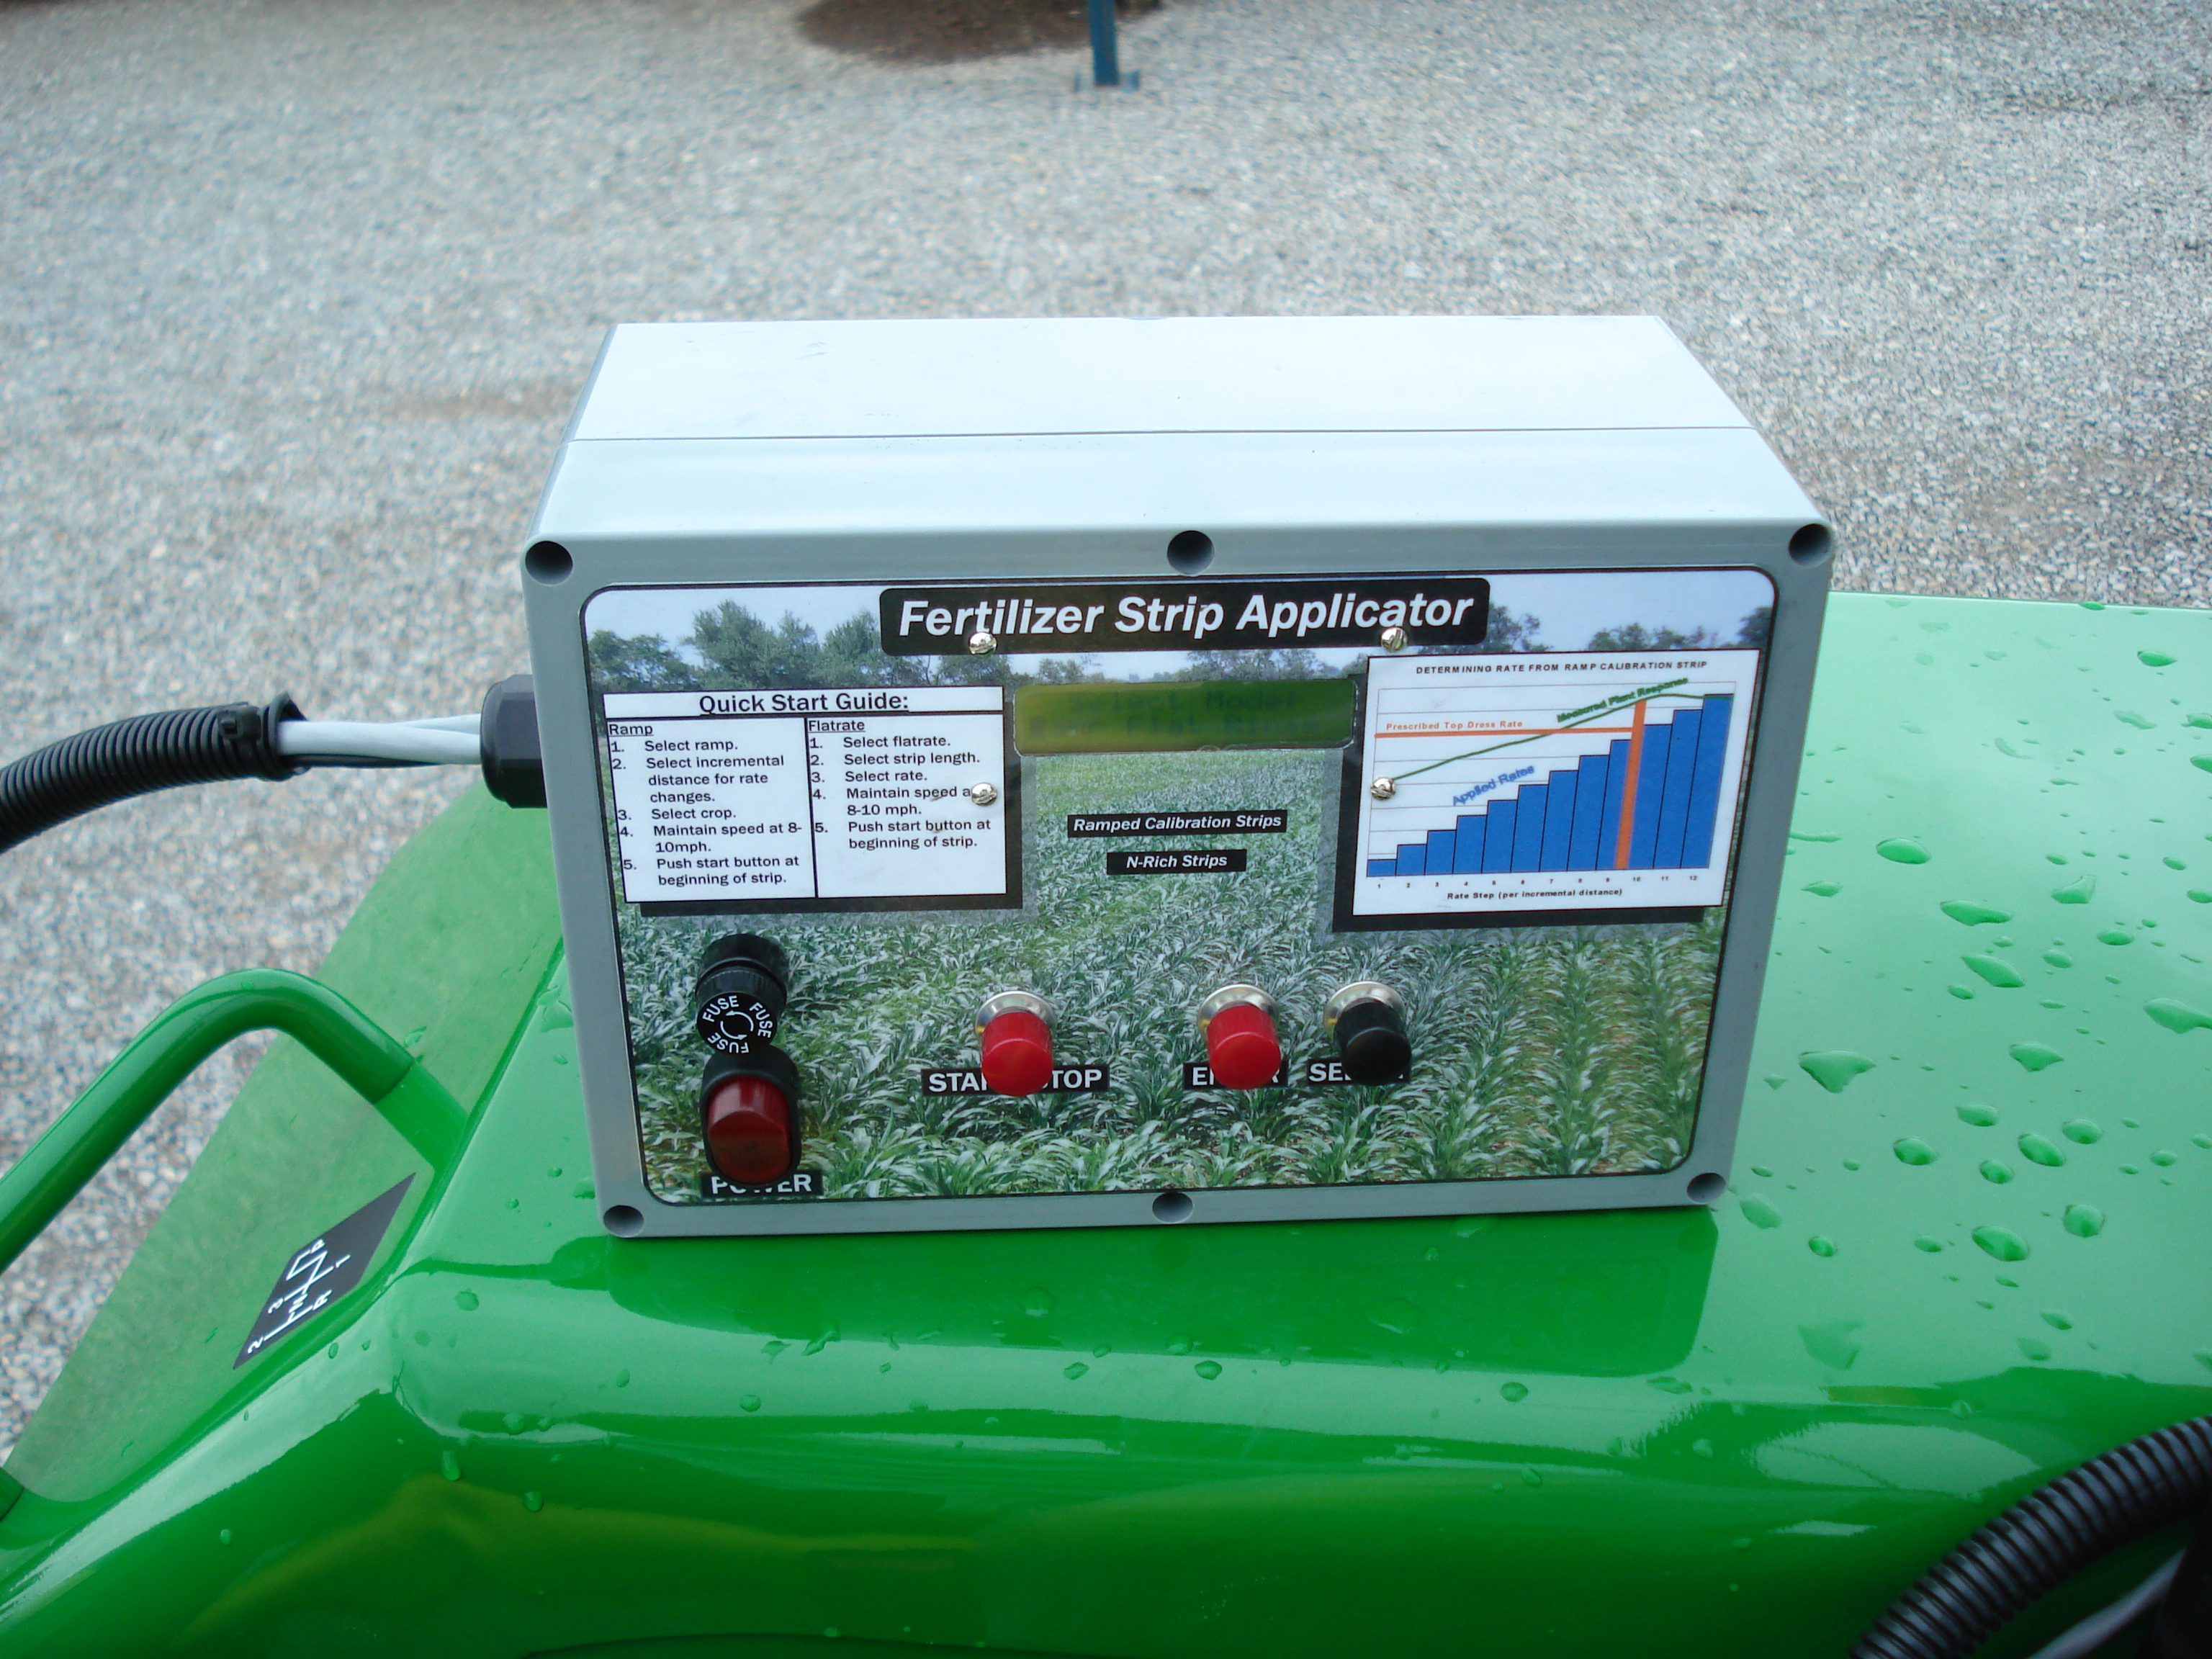
The new Ramped Calibration Strip Applicator applies 16 different N rates (10 to 20 foot intervals), over 160 to 320 feet (actual rates and distances can be adjusted depending on the crop). Companies interested in building variants of this applicator can adjust distances, N rates, intervals, etc., as they see fit. The Ramped Calibration Strip is used to visually determine precise mid-season fertilizer N rates for wheat and corn production. Although the use of hand-held GreenSeeker sensors are not required, the sensors offer the opportunity to sense the entire "RAMP" and thus accurately determine where the peak in NDVI exists over the range of N rates applied. Without the sensor, farmers can simply walk from one end of the RAMP to the other and stop where they no longer see any differences. Whether determined visually, or with a handheld sensor, the point where no differences no longer exist, is the TOPDRESS N Rate.
This methodology is a variant of what has been developed using the N Rich Strip and the handheld sensing technology that relies on predicted yields and the Sensor Based Nitrogen Rate Calculator (http://www.soiltesting.okstate.edu/SBNRC/SBNRC.php)
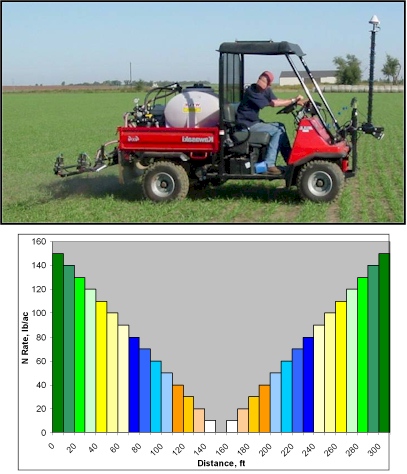
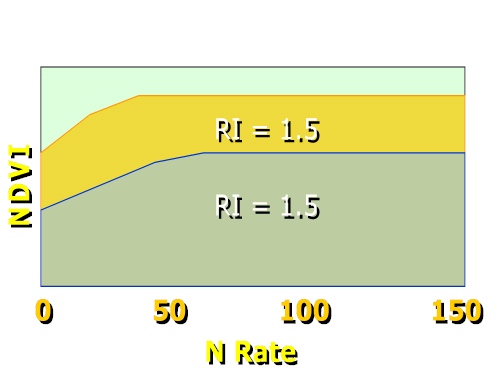
Looking at the graph above, you can see exactly why this is the case.
By stopping at the point (recording distance in feet) where there are no
longer visible or recorded differences in NDVI, you can plot a line directly
down to "distance" that has a predetermined N rate associated with it.
That N rate (depending on how you set up the intervals to change the rate,
and the actual rates chosen) is the TOPDRESS N Rate to be recommended.
For the 3 fields above where NDVI values were plotted with distance (green
squares, red triangles, and blue circles), the recommended topdress N rates
would have been 40, 80, and 100 lbs N/ac, respectively. Why? You
have to remember that the Ramped Calibration Strip is applied "ON-TOP" of the
farmer practice (whatever that may be). Assuming that we can "catch
up" and/or achieve maximum yields from the mid-season N application, and
assuming that yield potentials were not severely restricted by excess early
season N stress, the RAMP interpolated rate is how much you would need to
apply on the rest of the field to achieve the same "visible" or "NDVI
recorded" response.
In corn, some would argue that this methodology is flawed, because you don't
know whether or not this rate will "run out" later in the season. This
is to a certain extent correct, but if the farmer is wanting to avoid that
potential "risk" the topdress N rate can be increased by whatever amount
he/she deems appropriate. However, the RAMP is an incredible
starting point for determining the optimum mid-season N rate. Why?
Because we have now evaluated enough corn and wheat data to know that in
several long-term experiments (corn, NE, WI, MX; wheat, OK), there were
years where the check plot (No N Fertilizer ever applied) produced near
maximum yields. A RAMP N Rich Strip in those fields would have told us
"MID-SEASON" that there were no visible differences between the 0-N and all
other plots within the RAMP receiving N.
Wouldn't farmers want to know that? Wouldn't this be important to
know? If the check plots with no fertilizer N looked as
good as the fertilized plots, where was their N coming from? Over the
years, we have learned that warm wet winters (winter wheat) and warm wet
springs and early summer (corn) are conducive to increasing the amount of N
mineralized from soil organic matter, and that N deposition in rainfall
increases significantly in these years. Because we have years where
the demand for fertilizer N is less (and highly dependent on the
environment), and other years where it is cool and dry and the demand for
fertilizer N is greater. The only way to determine how much the
environment delivered for free is to have a Ramped Calibration Strip in each and
every field.
For those farmers/producers interested in using the sensors for determining their topdress N rates, all they have to do is mark the start and end of the Ramped Calibration Strip (preplant), and collect sensor data using the handheld GreenSeeker sensor walking at a constant speed over the length of the ramp. Using the program below, they can automatically read that file, and it will compute the optimum N rate. We recommend the use of the sensors simply because our eyes are not as sensitive in picking up these differences.
NOTE: This approach (interpreting the Ramped Calibration Strip) is for determining field rate application (flat rates) and accounts for only temporal variability. Simultaneous consideration of temporal and spatial variability requires on-the-go prediction of yield potential (YP0) and use of the response index for each 0.4m2 area (wheat), and every 2-3 plants in corn.
Ramp
Data Processor (excel version 1.5)
Example File (Morrison)
Example Data (Salmon) below
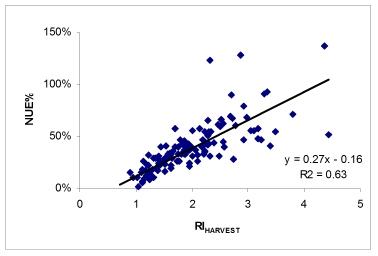
Relationship between RI (determined at harvest) and the nitrogen use
efficiency observed over time, Experiment 502, 1971-2005.
The relationship between RI NDVI and the final N recommendation using SBNRC is listed above.
 The Ramped N
Reference Strip will allow researchers to refine mid-season fertilizer N
rates by knowing exactly what the RI was (NDVI Max, divided by NDVI Min),
and by integrating the area under the curve over the distance included
within the ramp (currently set at 150 feet, but than can be altered to
increased rate change intervals).
The Ramped N
Reference Strip will allow researchers to refine mid-season fertilizer N
rates by knowing exactly what the RI was (NDVI Max, divided by NDVI Min),
and by integrating the area under the curve over the distance included
within the ramp (currently set at 150 feet, but than can be altered to
increased rate change intervals).
 Click
on the Question to See the VIDEO.
Click
on the Question to See the VIDEO.Tom Denker, Farmer near Enid, OK
Question: What is the benefit of GreenSeeker Technology?
Question: What do you think about OSU working with private industry to make this type of technology available to producers?
Question: Would you like to add anything?
Jerrel Powell, Farmer near Council Hill, OK
Question: How have you used GreenSeeker
Technology?
Question: Why is Nitrogen Important?
Question: What would you like to tell
producers in OK about GreenSeeker Technology?
_files/Obregon2003_farmer.jpg)
Wheat farmer in Ciudad Obregon, Mexico displays on his right hand (3, for 300 kg urea applied preplant) and on his left hand (0, for 0 kg urea applied preplant). The N rich strip and response index indicated that NO topdress N should be applied. The farmer was elated.
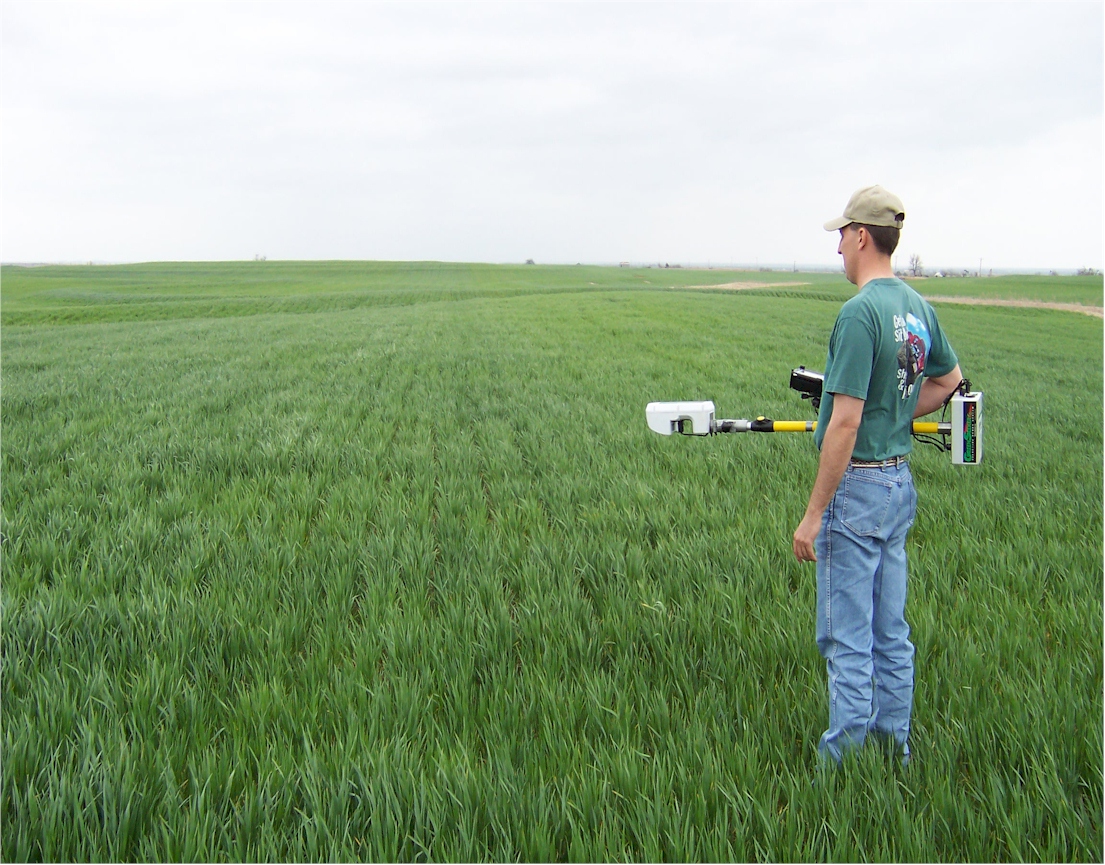
Loy Marshall, N Rich STrip on Left (RI = 1.38 at this site). Jason Lawles (NTech Industries, www.ntechindustries.com ) inspects the N Rich Strip prior to taking NDVI sensor readings.
Managing N Fertilizer Using a N-Rich-Strip: Projected Profitability
62 locations in Oklahoma, 1998-2003