 Nitrogen
Use Efficiency Definitions
Nitrogen
Use Efficiency Definitions


Agronomy Journal 91: 357-363
 Importance of "YIELD" for estimating Nitrogen Use Efficiency
Keeney 1982 Justification, (reference used in AJ 91:357)
Difference method
PFR = (NF)-(NC) / R
NF = total crop N uptake (corn, wheat, rice, etc.) from fertilized plots
NC = total crop N uptake (corn, wheat, rice, etc.) from unfertilized plots
R = rate of fertilizer N applied
PFR = percent fertilizer recovery
EXAMPLE below:
| Applied N | Grain Yield | Grain N | N uptake | Fertilizer Recovery |
| kg/ha | kg/ha | % | kg/ha | (NUE), % |
| 0 | 1000 | 2 | 20 | - |
| 50 | 1300 | 2.1 | 27.3 | (27.3-20)/50=14.6 |
| 100 | 2000 | 2.2 | 44 | (44-20)/100=24 |
| 150 | 2000 | 2.3 | 46 | (46-20)/150=17 |
Agronomy Journal 91:357
1. Components of NUE (added discussion of Moll et al. (1982)
2. Text, Components of NUE (added discussion)
P
Consideration of additional parameters not discussed in Moll et al. (1982) *plant N loss
- Maximum N accumulation has been found to occur at or near flowering in wheat and corn and not at harvest.
- In order to estimate plant N loss without the use of labeled N forms, the stage of growth where maximum N accumulation is known to occur needs to be identified.
- The amount of N remaining in the grain + straw or stover, is subtracted from the amount at maximum N accumulation to estimate potential plant N loss (difference method).
- Use of difference methods for estimating plant N loss are flawed since continued uptake is known to take place beyond flowering or the point of maximum N accumulation.
COMPONENTS of NUE (Moll et al., 1982), graphic illustration
Enriched 15N:
Materials with a greater than natural concentration of
15N
% plant N derived from fertilizer = %15N excess in sample
% 15N excess in fertilizer
Depleted 15N:
Materials with a lower than natural concentration of
15N (0.003 - 0.01 atom % 15N) or (< 0.01 atom % 15N)
Use of isotopic 14N
Studies involving residual soil nitrogen are not practical with depleted materials due to the high dilution factor
% plant N derived from the fertilizer =
(Nu - Nt)/(Nu - (Nf/n))
Nu =atom % 15N in unfertilized plants
Nt = atom % 15N in fertilized plants
Nf = atom % 15N in the fertilizer (for example 0.006%)
n = the plant discrimination factor between 14N and 15N.
If it is assumed that there is no discrimination between 14N and 15N, then n =
1.
1. Difference method
PFR = (NF)-(NC) / R
NF = total N uptake in corn from N fertilized plots
NC = total N uptake in corn from unfertilized plots
R = rate of fertilizer N applied
PFR = percent fertilizer recovery
2. Isotopic method (Depleted material)
PFR = ((NF) x (C-B)/D) / R
NF = total N uptake in corn from N fertilized
plots
B = atom % 15N of plant tissue from N fertilized plots
C = atom % 15N of plant tissue from unfertilized plots (0.366%)
D = depleted atom % 15N in applied N fertilizer
R = rate of applied 15N-labeled fertilizer
3. Isotopic method (Enriched material, Sanchez et al.,
1987)
F = As-Ar/Af-Ar
F= fraction of total N uptake derived from 15N enriched fertilizer
As = atom % 15N measured in the harvested plant sample
Af = atom % 15N in the enriched fertilizer
Ar = atom % 15N of the reference harvested plant material from non 15N enriched
fertilizer treatments
Ef = F x total N uptake
Ef = uptake of 15N enriched fertilizer
d15N = atom % 15N (sample) - atom % 15N (standard) x 1000 / atom % 15 N (standard)
15N composition of the total N of grain and leaf samples of corn (Zea mays L.) decreased systematically as N fertilizer rates increased (Kohl et al., 1973). This result was considered to be consistent with increasing contributions of fertilizer N to plants as the rate of applied N increased.
Hauck and Bremner, 1976
percent nitrogen recovered (plant or soil) =
= 100P (c-b) / f(a-b)
P = total N in the plant part or soil in kg
ha-1
f = rate of 15N fertilizer applied
a = atom percent 15N in the labeled fertilizer
b = atom percent 15N in the plant part or soil receiving no 15N
c = atom percent 15N in the plant part or soil that did receive 15N
unlabeled N uptake = (total N uptake in grain and straw) -
[N rate(% recovery of 15N in grain and straw)]
The Magruder Plots are the oldest continuous soil fertility wheat research plots in the Great Plains region, and are one of the oldest continuous soil fertility wheat plots in the world.
They were initiated in 1892 by Alexander C. Magruder who was interested in the productivity of native prairie soils when sown continuously to winter wheat.
Simple estimate of nitrogen (N) balance
1. account for N applied,
2. account for N removed in the grain
3. account for estimated plant N loss, denitrification, nitrate leaching
4. account for non-symbiotic N fixation, N applied in the rainfall,
5. have an estimate of total soil N (0-30 cm) at the beginning of the experiment
6. have an estimate of total soil N (0-30 cm) at the end of the experiment
Manure plots: total soil N decreased from 6890 kg N ha-1 in the surface 0-30 cm in 1892, to 3198 kg N ha-1 in 2002.
Check plots (no nutrients applied for 109 years) only 2411 kg N ha-1 or 35% of the original total soil organic N remains.
Nitrogen removed in the grain averaged 38.4 kg N ha-1yr-1
N additions (manure, N in rainfall, N via symbiotic N fixation) averaged 44.5 kg N ha-1 yr-1 in the Manure plots.
Following 109 years, unaccounted N ranged from 229 to 1395 kg N ha-1.
By year basis, translates into 2 to 13 kg N ha-1yr-1 that were unaccounted
Manure plots, estimate of nitrogen use efficiency (NUE) (N removed in the grain, minus N removed in the grain of the check plots, divided by the rate of N applied) was 32.8%
Similar to the 33% NUE for world cereal production reported in 1999.
World Nitrogen Use Efficiency for Cereal Production is 33%
Agronomy Journal, 91:357-363
EMAG_17
 References
(Papers showing that NUE is between 30 and 40%)
References
(Papers showing that NUE is between 30 and 40%)
NUE:
27-33%
Davis, R.L., J.J. Patton, R.K. Teal, Y. Tang, M.T. Humphreys, J. Mosali, K. Girma, J.W. Lawles, S.M. Moges, A. Malapati, J.Si, H. Zhang, S. Deng, G.V. Johnson, R.W. Mullen, and W.R. Raun. 2003. Nitrogen balance in the Magruder Plots following 109 years in continuous winter wheat. J. Plant Nutr. 26(8):1561-1580.
NUE: 32.8%
Raun,
W.R. and G.V. Johnson. 1999. Improving Nitrogen Use Efficiency for Cereal
Production. Agron. J. 91:357-363
NUE: 33%
(maize, rice, barley, sorghum, millet, oat, and rye)
Moll, R.H., E.J.
Kamprath, and W.A. Jackson. 1982. Analysis and interpretation of factors
which contribute to efficiency to nitrogen utilization. Agron. J.
74:562-564.
Olson, R.V., and C.W. Swallow. 1984. Fate of labeled
nitrogen fertilizer applied to winter wheat for five years. Soil Sci. Soc.
Am. J. 48:583-586.
NUE: 27-33%
NUE: 17-50%
NUE: > 100%
Vetsch, Jeff, and Gyles Randall. 2004. Corn production as affected by
nitrogen application timing and tillage. Agron. J. 96:502-509.
Aparent N Recovery (87% for spring, 45% for fall applied N)
Varvel,
G.E., and T.A. Peterson. 1990. Nitrogen fertilizer recovery by corn in
monoculture and rotation systems. Agron. J. 82:935 to 938.
Methods to
Improve, and/or measure NUE
Raun, W.R., J.B. Solie, M.L. Stone, K.L. Martin, K.W. Freeman, R.W. Mullen,
H. Zhang J.S. Schepers, and G.V. Johnson. 2005. Optical sensor based
algorithm for crop nitrogen fertilization. Commun. Soil Sci. Plant Anal.
36:2759-2781.
Vose, P. 1980.
Introduction to nuclear techniques in agronomy and plant biology. Oxford,
UK: Pergamon, 391 pp.
Amazon Listing
| NUE Results, Different Methods | |||||
| Method | Authors | Crop | Year | NUE | Site Years |
| Difference | Olson and Swallow, SSSAJ | Winter Wheat | 1984 | 27 - 33% | 5 |
| Mass Balance | Davis et al., JPN | Winter Wheat | 2003 | 32.8 | 109 |
| Global Data | Raun and Johnson, AJ | Cereals | 1999 | 33 | comp. 1996 |
| NUE components | Moll et al., AJ | Maize | 1981 | NA | 1 |
| Difference | Raun et al., AJ | Winter Wheat | 2002 | 17-50 | 4 |
| Difference/MB | Edmonds et al., JPN | Cereals | 2009 | 100 | comp. 2008 |
| Apparent N recovery | Vetsch and Randall, AJ | Maize | 2004 | 66 to 90 | 3 |
| 15N and Difference | Varvel and Peterson, AJ | Maize | 1990 | 43 to 58 | 4 |
| 15N and Difference | Olson, SSSAJ | Maize | 1980 | 26 | 2 |
| Difference | Barbieri et al., AJ | Maize | 2008 | 32.2 | 3 |
1. Increased plant N loss with increasing nitrogen applied in winter wheat observed with 15N. J. Plant Nutr. 23:219-230. (Lees et al., 2000)
2. Post-anthesis nitrogen loss from corn. Agron. J. 85:659-663. (Francis et al., 1981)
3. Effect of nitrogen rate on plant nitrogen loss in winter wheat varieties. Desta et al. (1997). J. of Plant Nutr. 20:389-404. (pdf)
4. Gaseous Nitrogen Loss from Soybean Foliage
Nitrogen Cycle Page
Combined Feekes growth stages, and corresponding GDD's, Oklahoma
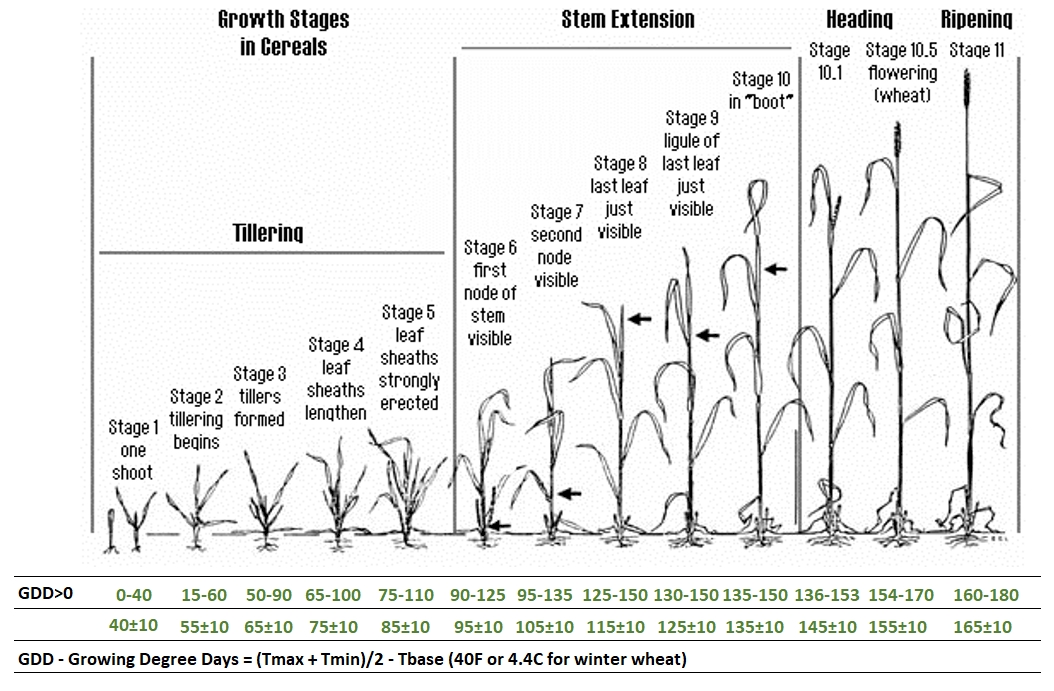
Large, E.C. 1954. Growth stages in cereals. Plant Pathol. 3:128-129.
COMPOSITE FILE, NUE (several methods to estimate NUE delineated)